Visual exploration
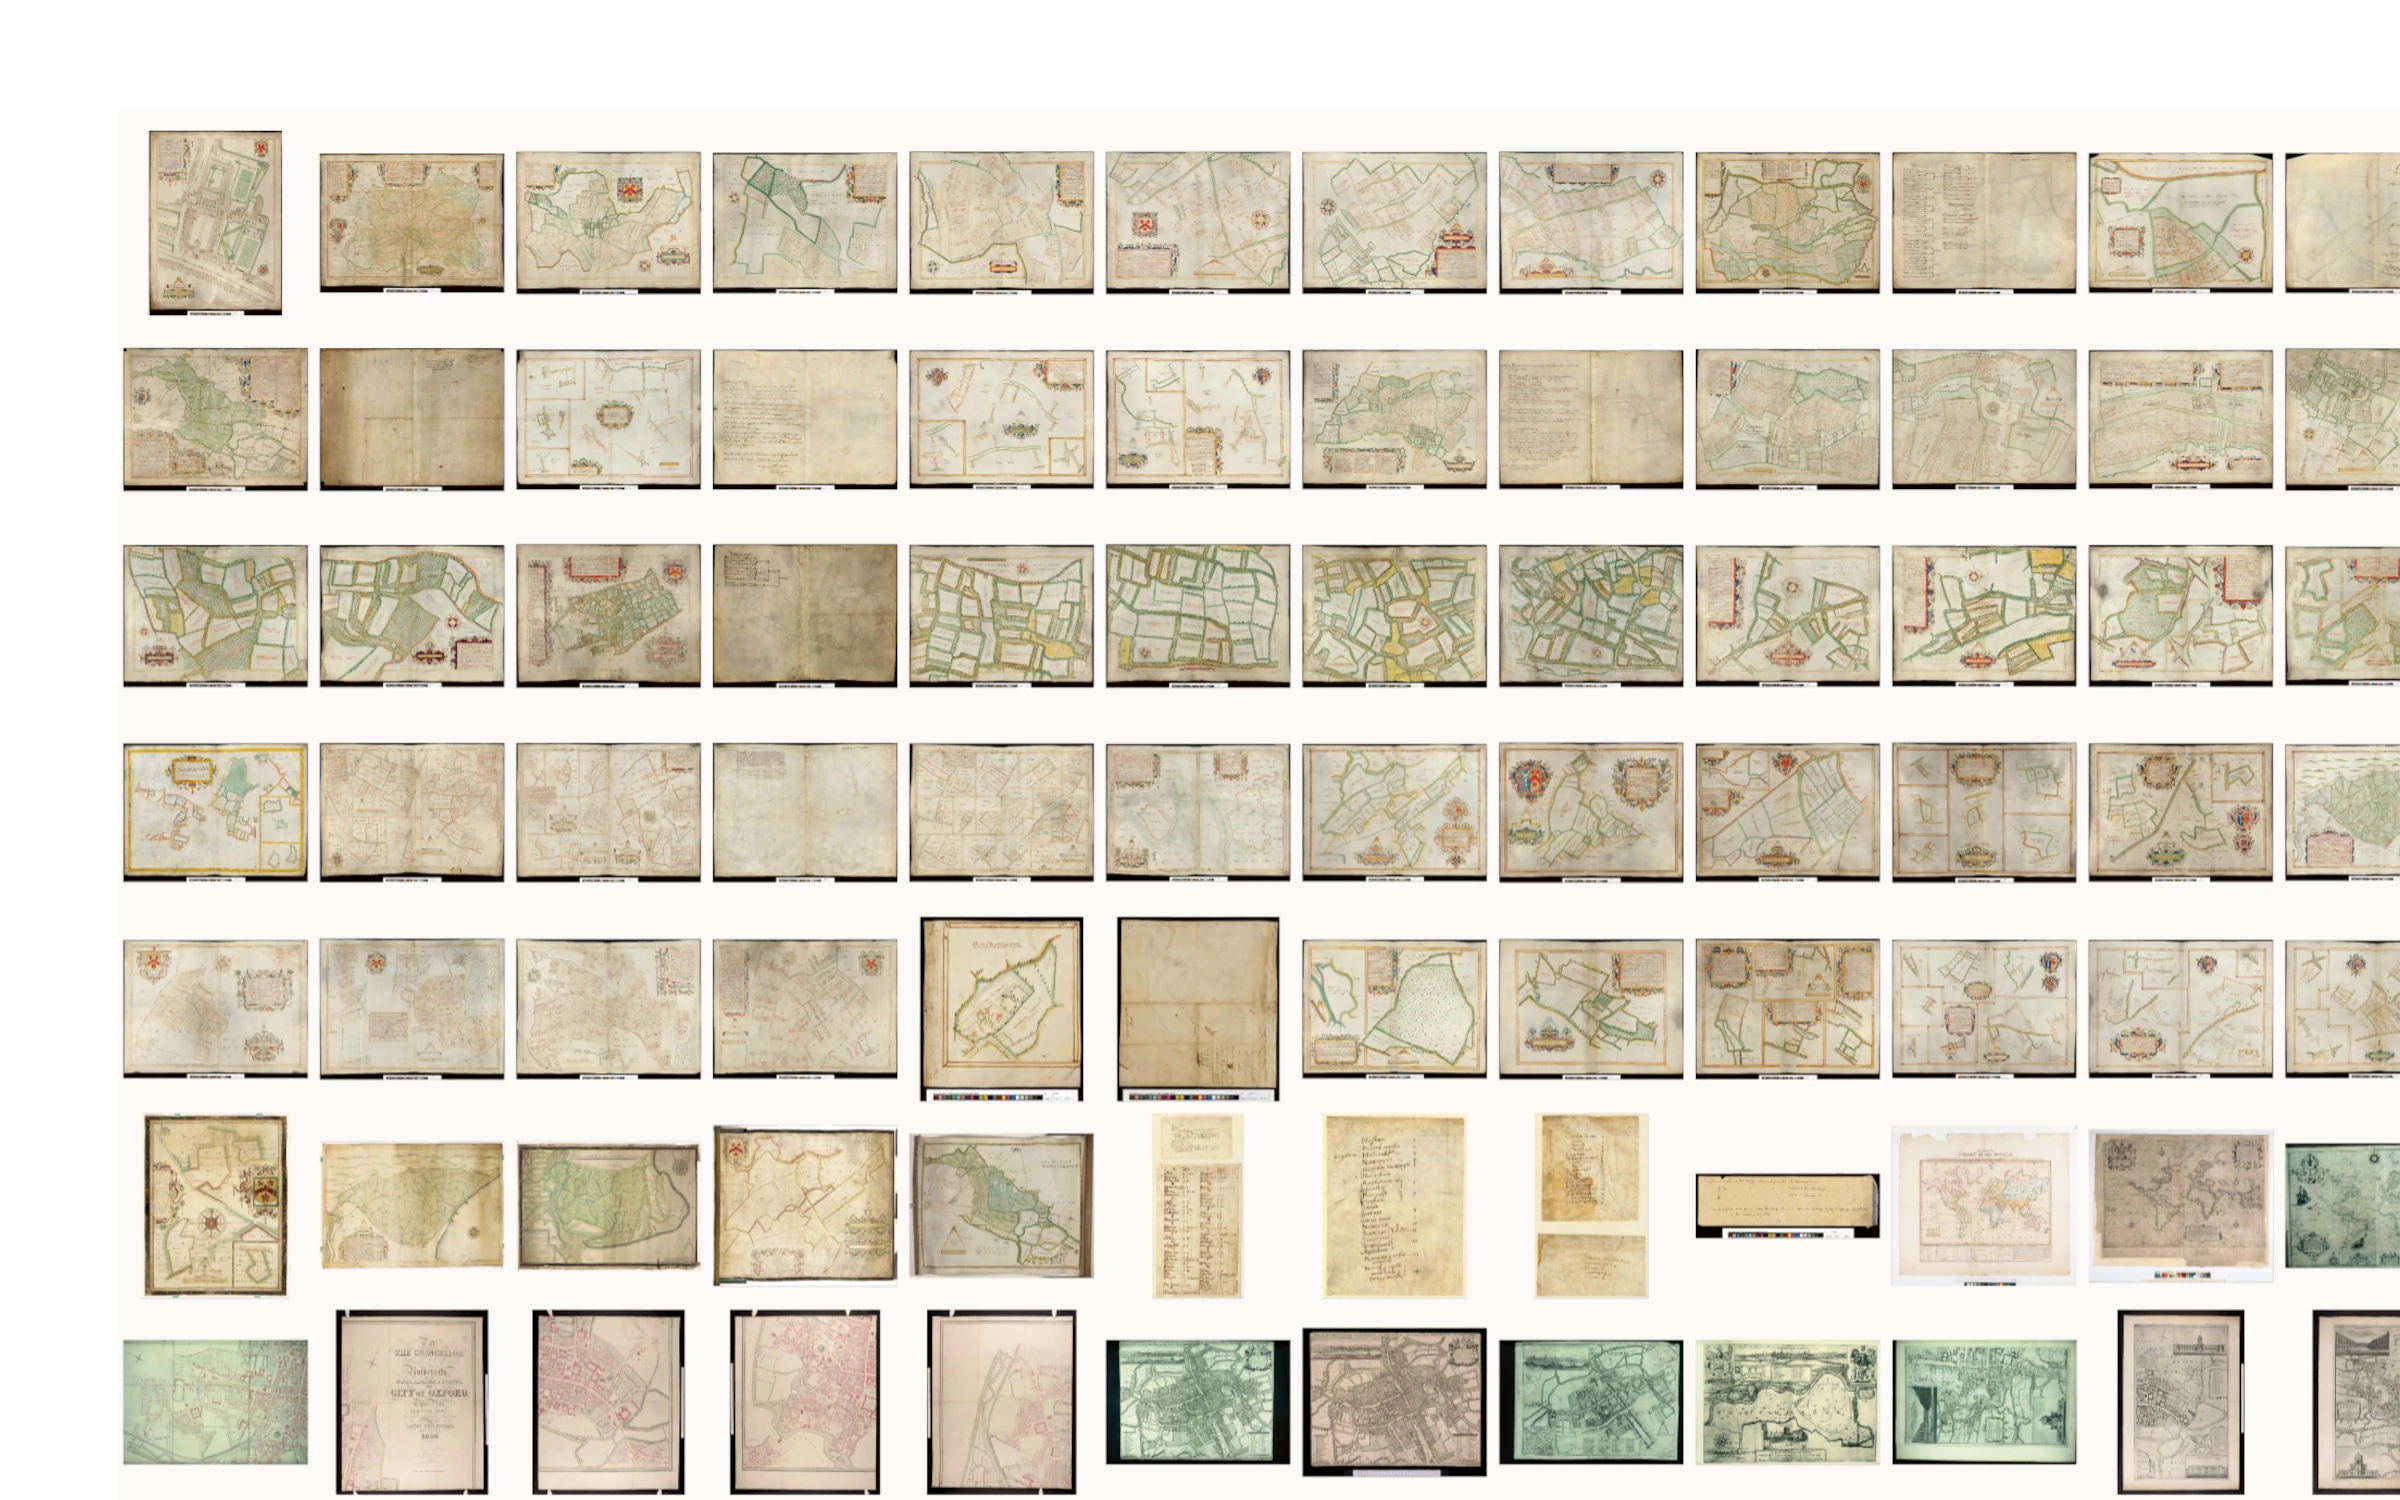
Browse thousands of items as a visual grid. Sort, filter, and group by any field. Zoom from overview to individual record in a click.
Zegami lets you interactively browse, filter, and compare thousands of data points — images, documents, time series, geospatial — in a single view.
Not a dashboard. Not a database.

Spreadsheets flatten everything into rows. Dashboards show you summaries. Neither lets you actually look at your data.
Zegami gives you the full picture, literally. Lay out thousands of images, data points, or documents visually. Filter, sort, group, and zoom in on what matters. Spot patterns that no chart would show you.
Browse thousands of items as a visual grid. Sort, filter, and group by any field. Zoom from overview to individual record in a click.
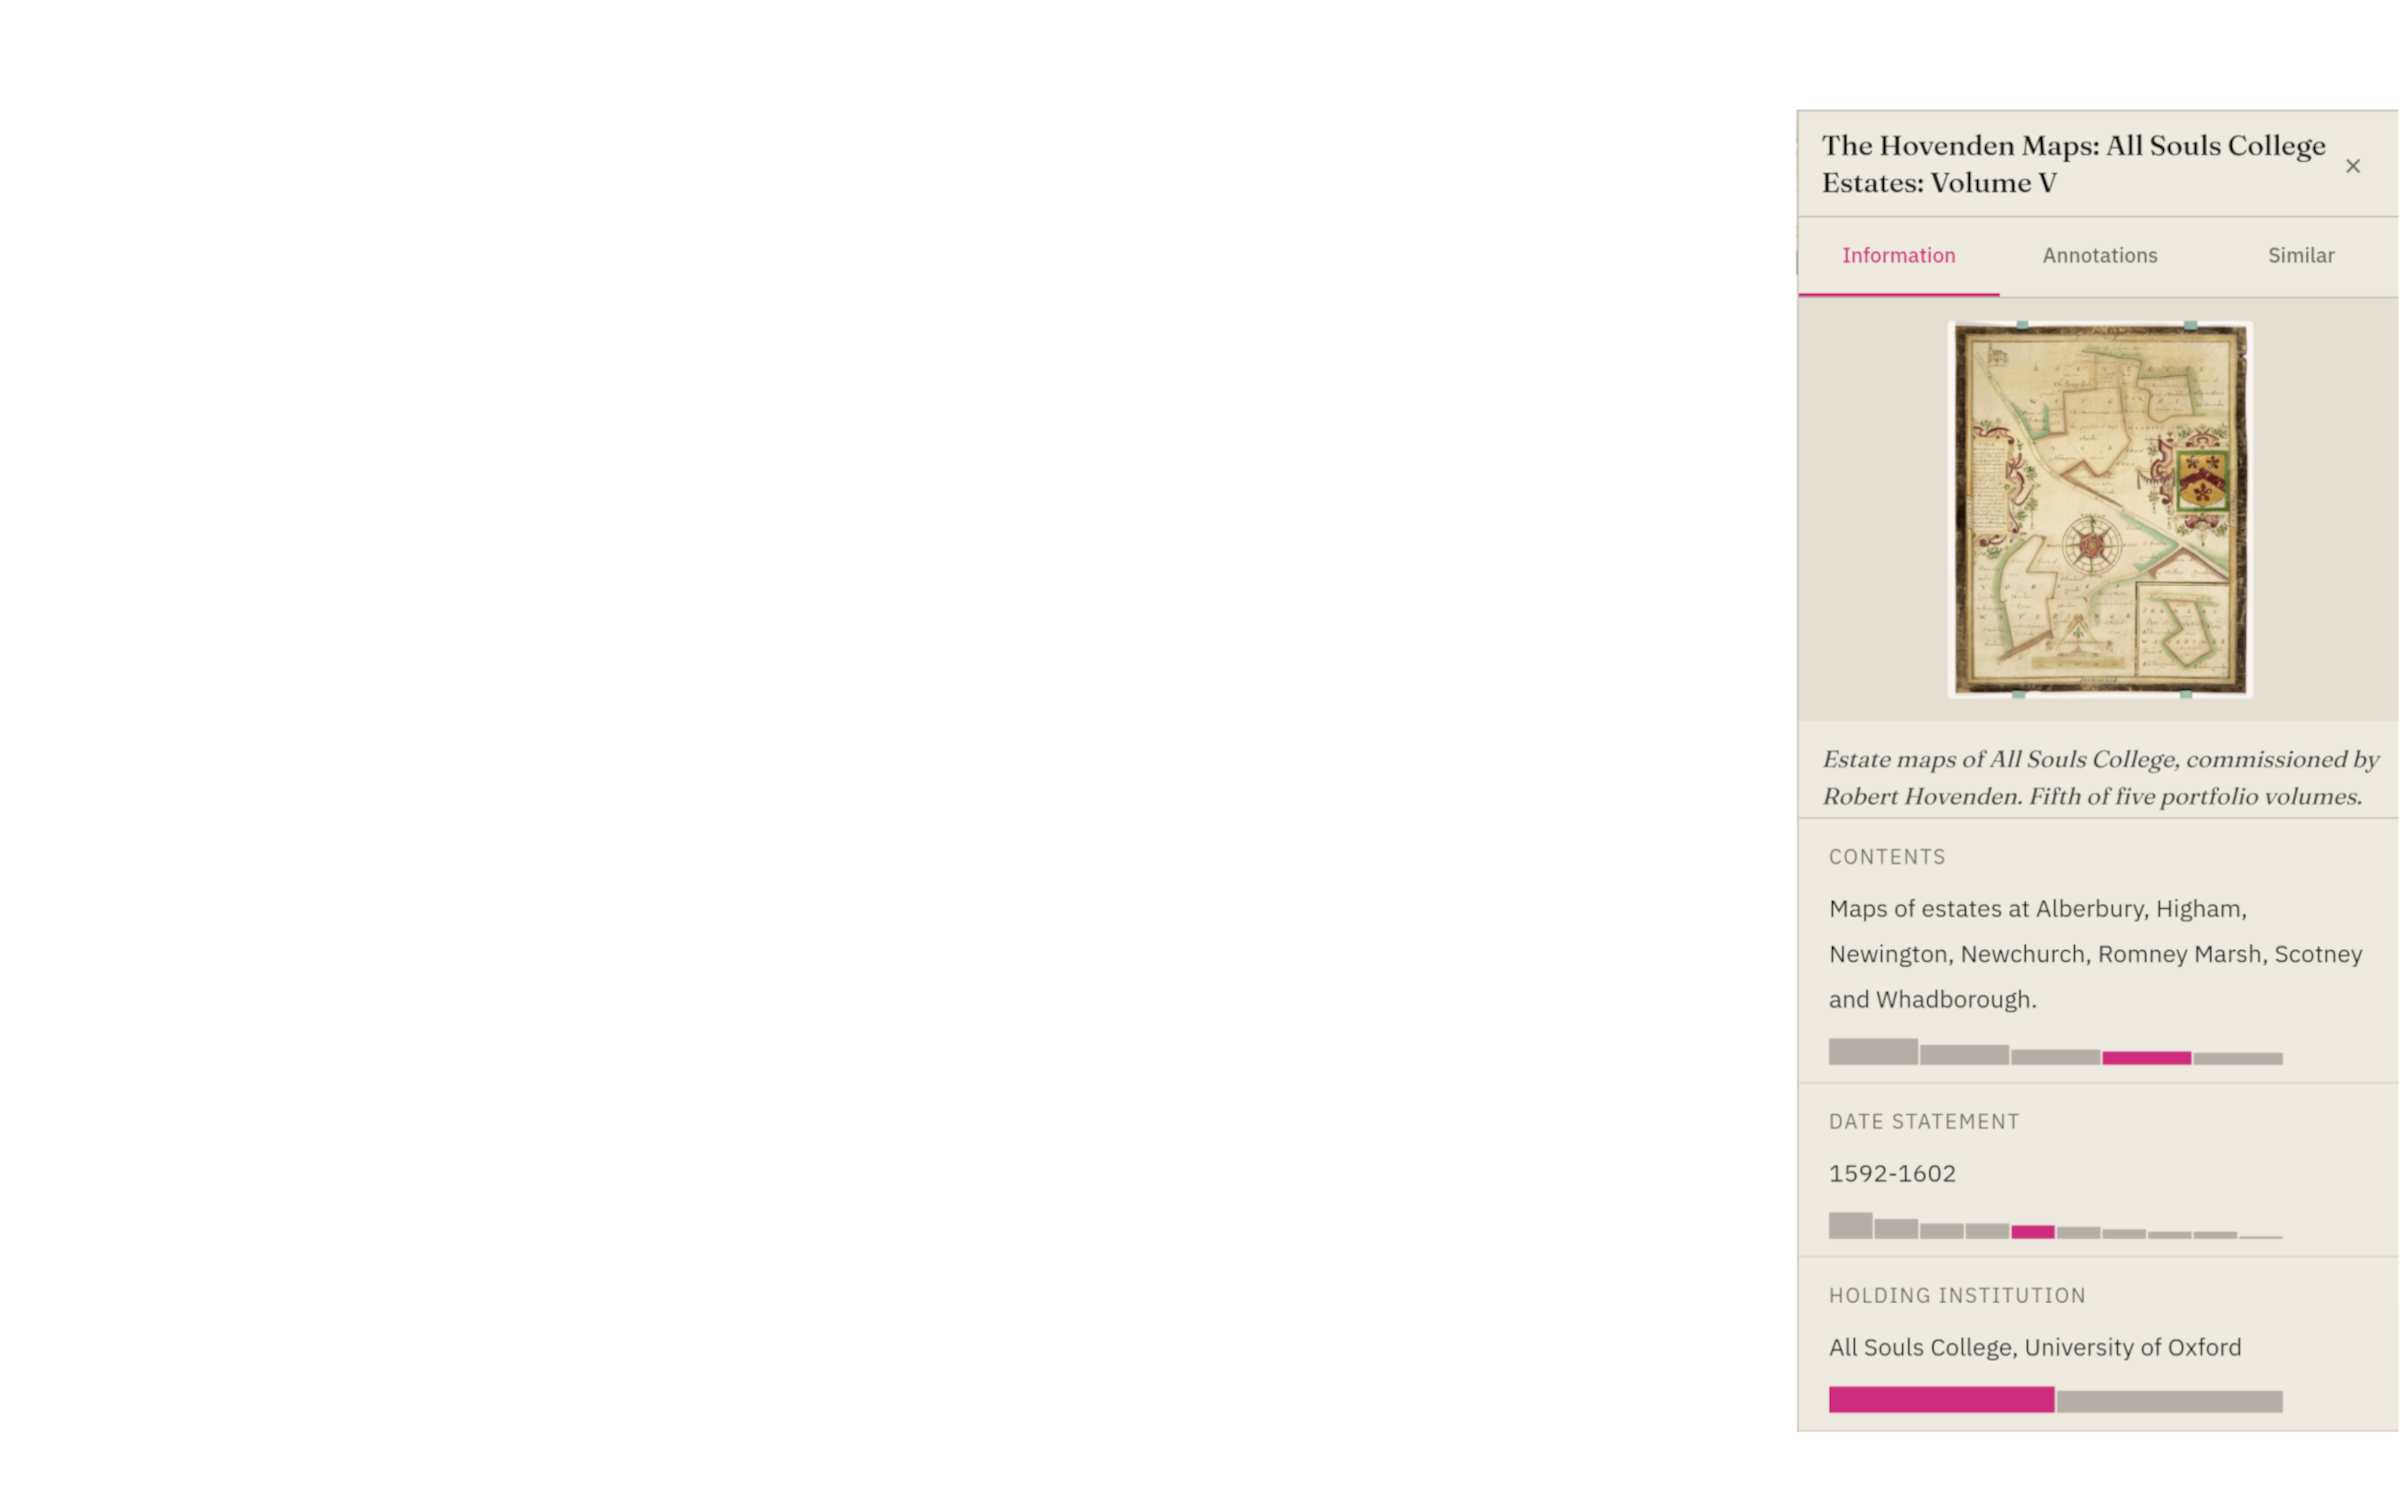
Purpose-built for datasets where images matter: camera traps, microscopy, aerial surveys, historical archives. See images alongside metadata, not buried in folders.
Plot your data on a map. Filter spatially. Understand how location relates to everything else in your dataset.
Layer in temporal data. Compare trends across groups. Link chart selections back to individual records.
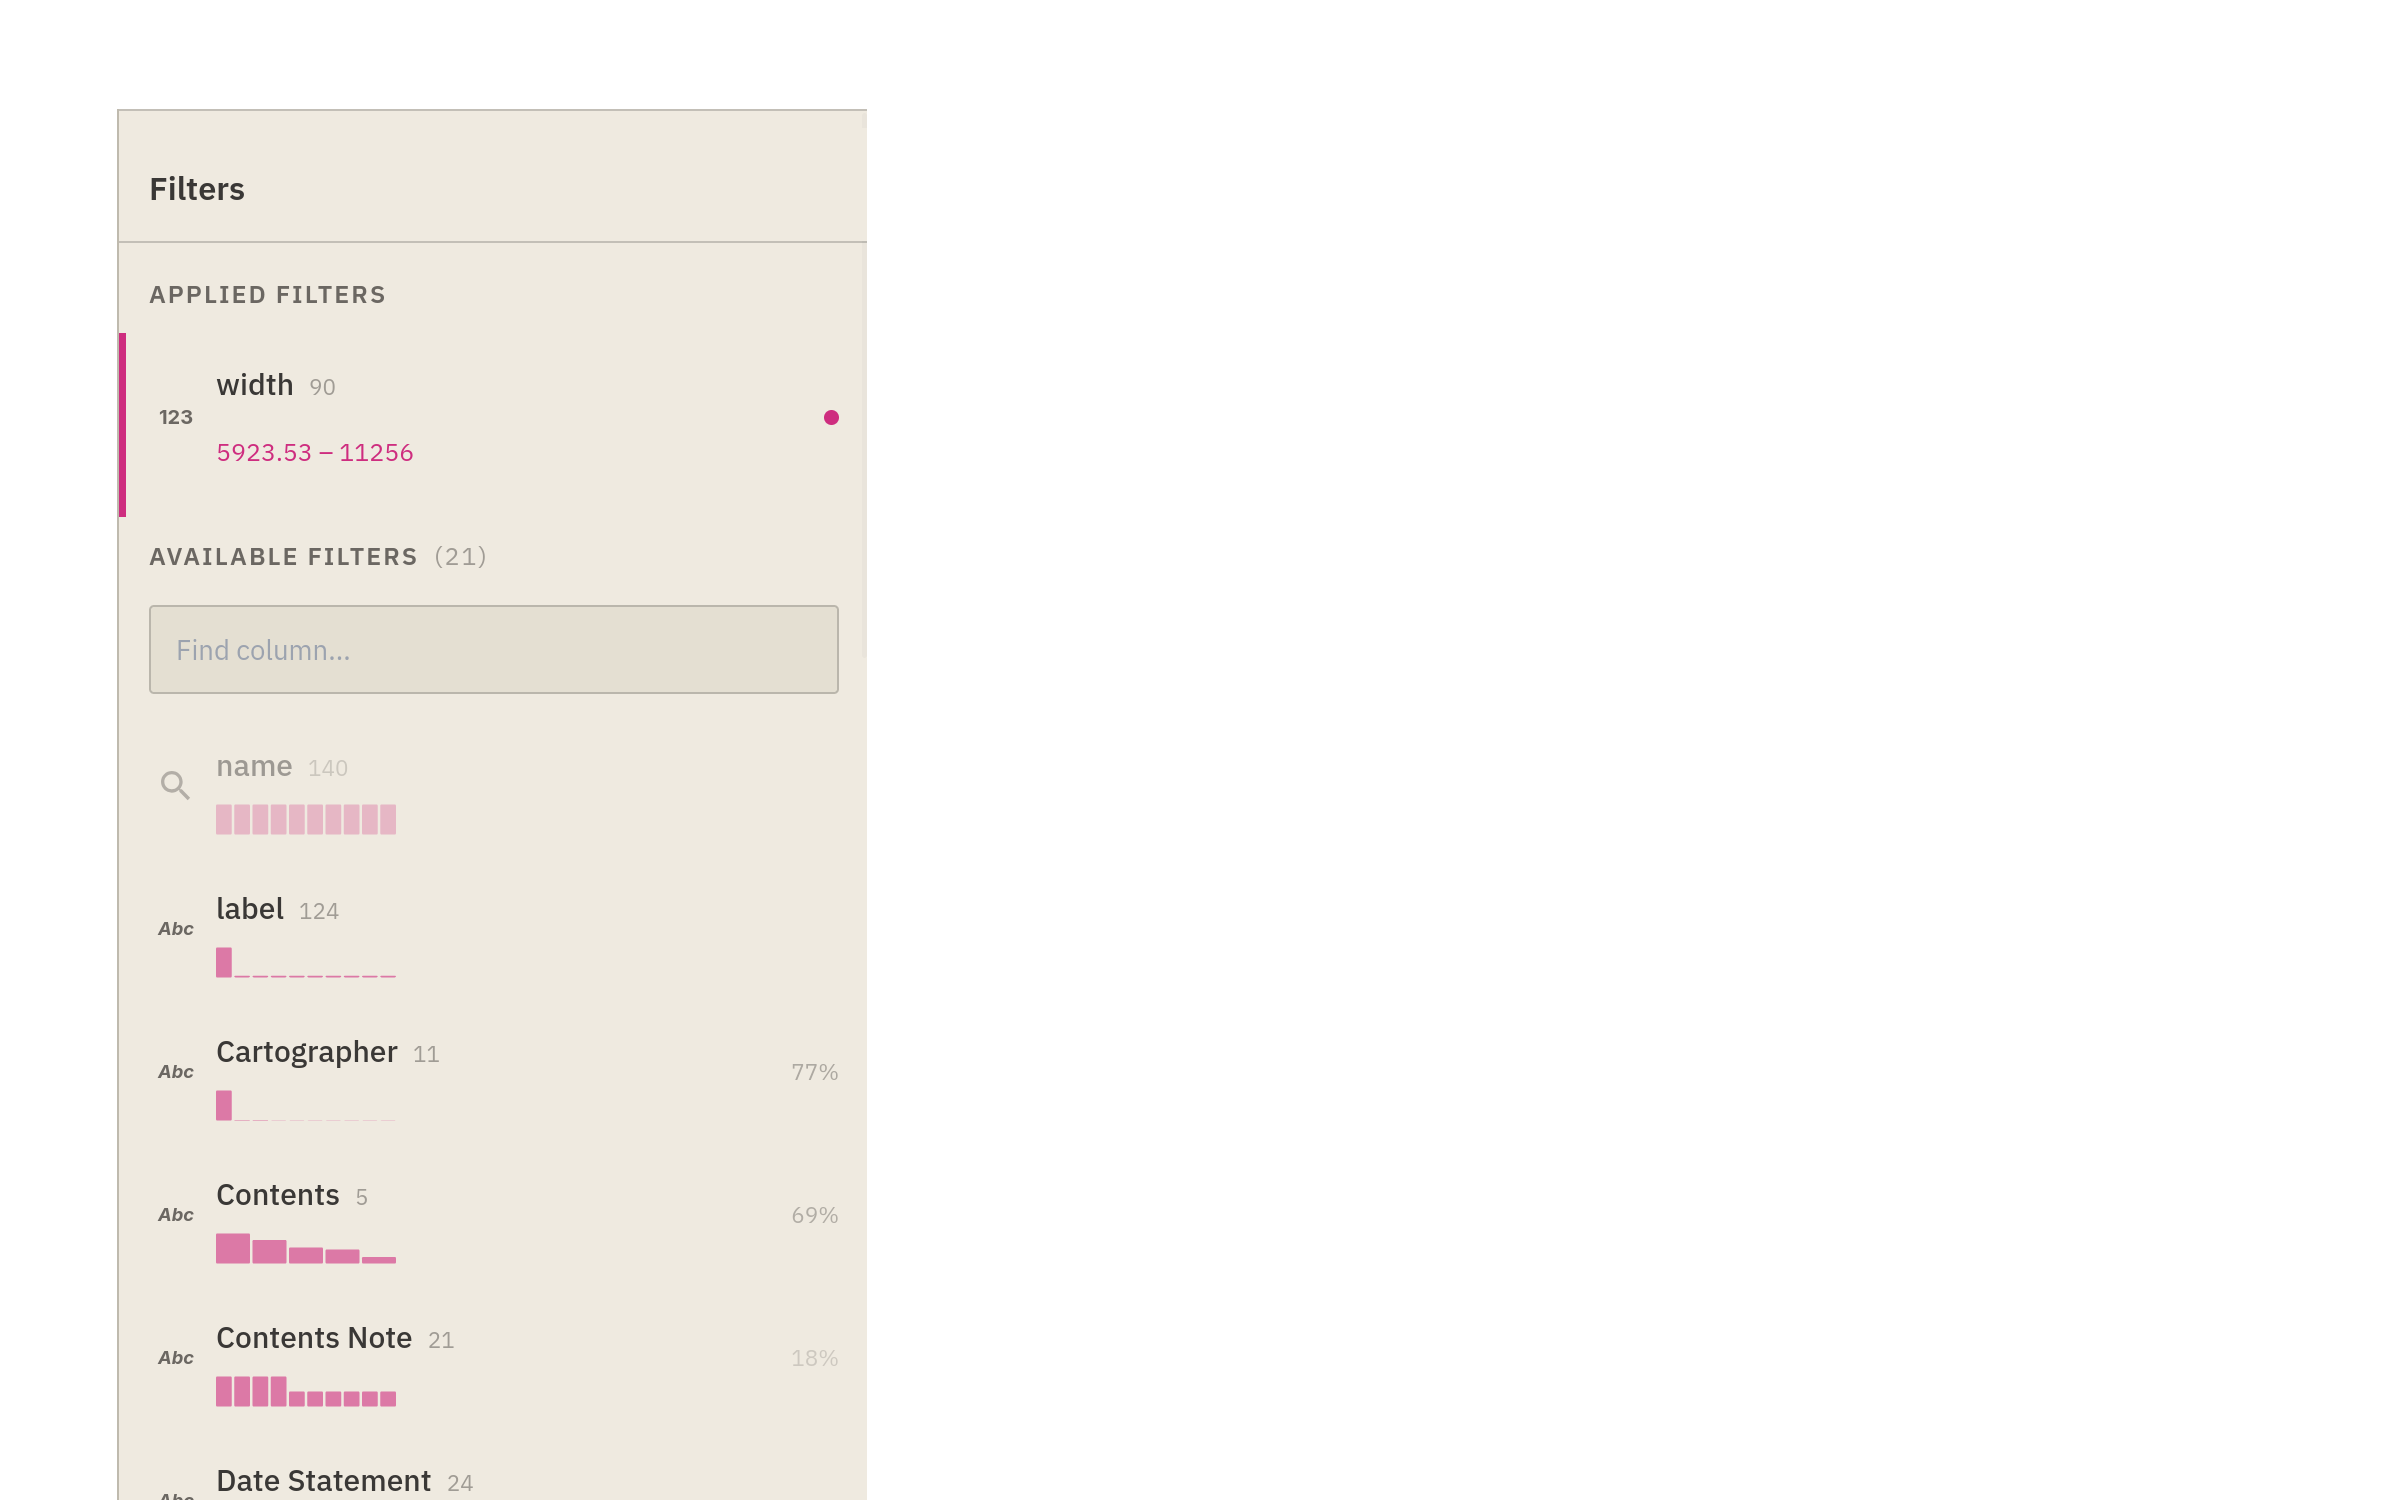
Combine filters across any dimension — numeric ranges, categories, text search, date ranges. Every filter updates every view in real time.
High-throughput imaging, phenotyping, pathology, microscopy. Researchers use Zegami to visually QA and explore imaging datasets that are too large to review manually.
Camera trap review, biodiversity surveys, habitat assessment. Explore species detections across sites, time periods, and sensor types in a single view.
Museum collections, historical archives, manuscript analysis. Scholars use Zegami to explore and annotate large visual collections without specialist software.
Quality control imaging, asset inspection, document review. Any workflow where people need to visually assess large volumes of data.
From raw data to a live, shareable view in under ten minutes. No pipeline, no ticketing queue, no specialist tooling. Your domain knowledge plus our platform.
Upload a spreadsheet, connect to an API, or point Zegami at an image folder. Structured and unstructured data, together.
Every record becomes a tile. Filter, sort, and group across any combination of fields. Switch between grid, map, chart, and detail views.
Publish collections for your team or publicly. Save views. Export filtered subsets. No training required.
“Without Zegami I wouldn’t be able to feasibly accomplish my project in a reasonable amount of time. It just allows me to go through large amount of information in batches rather than individually and it is a complete game changer.”
“If you’re taking 10,000 images a day, they’re not for humans to look at’. With Zegami, we are able to look at them again, and quickly determine which ones we might want to examine further.”
“The Zegami machine learning tool sets and personnel distinguish the company from other providers. They have the exact mix of knowledge and creativity on their team that we need. Their software and expertise have accelerated helping us achieve our goals.”
Born from research at the University of Oxford and developed over ten years, Zegami is used in production by research institutions, government agencies, and commercial organisations worldwide.