The tools inside.
Seven core capabilities you can compose to match any visual-data workflow — from rapid triage of research datasets to regulated pharmaceutical review.
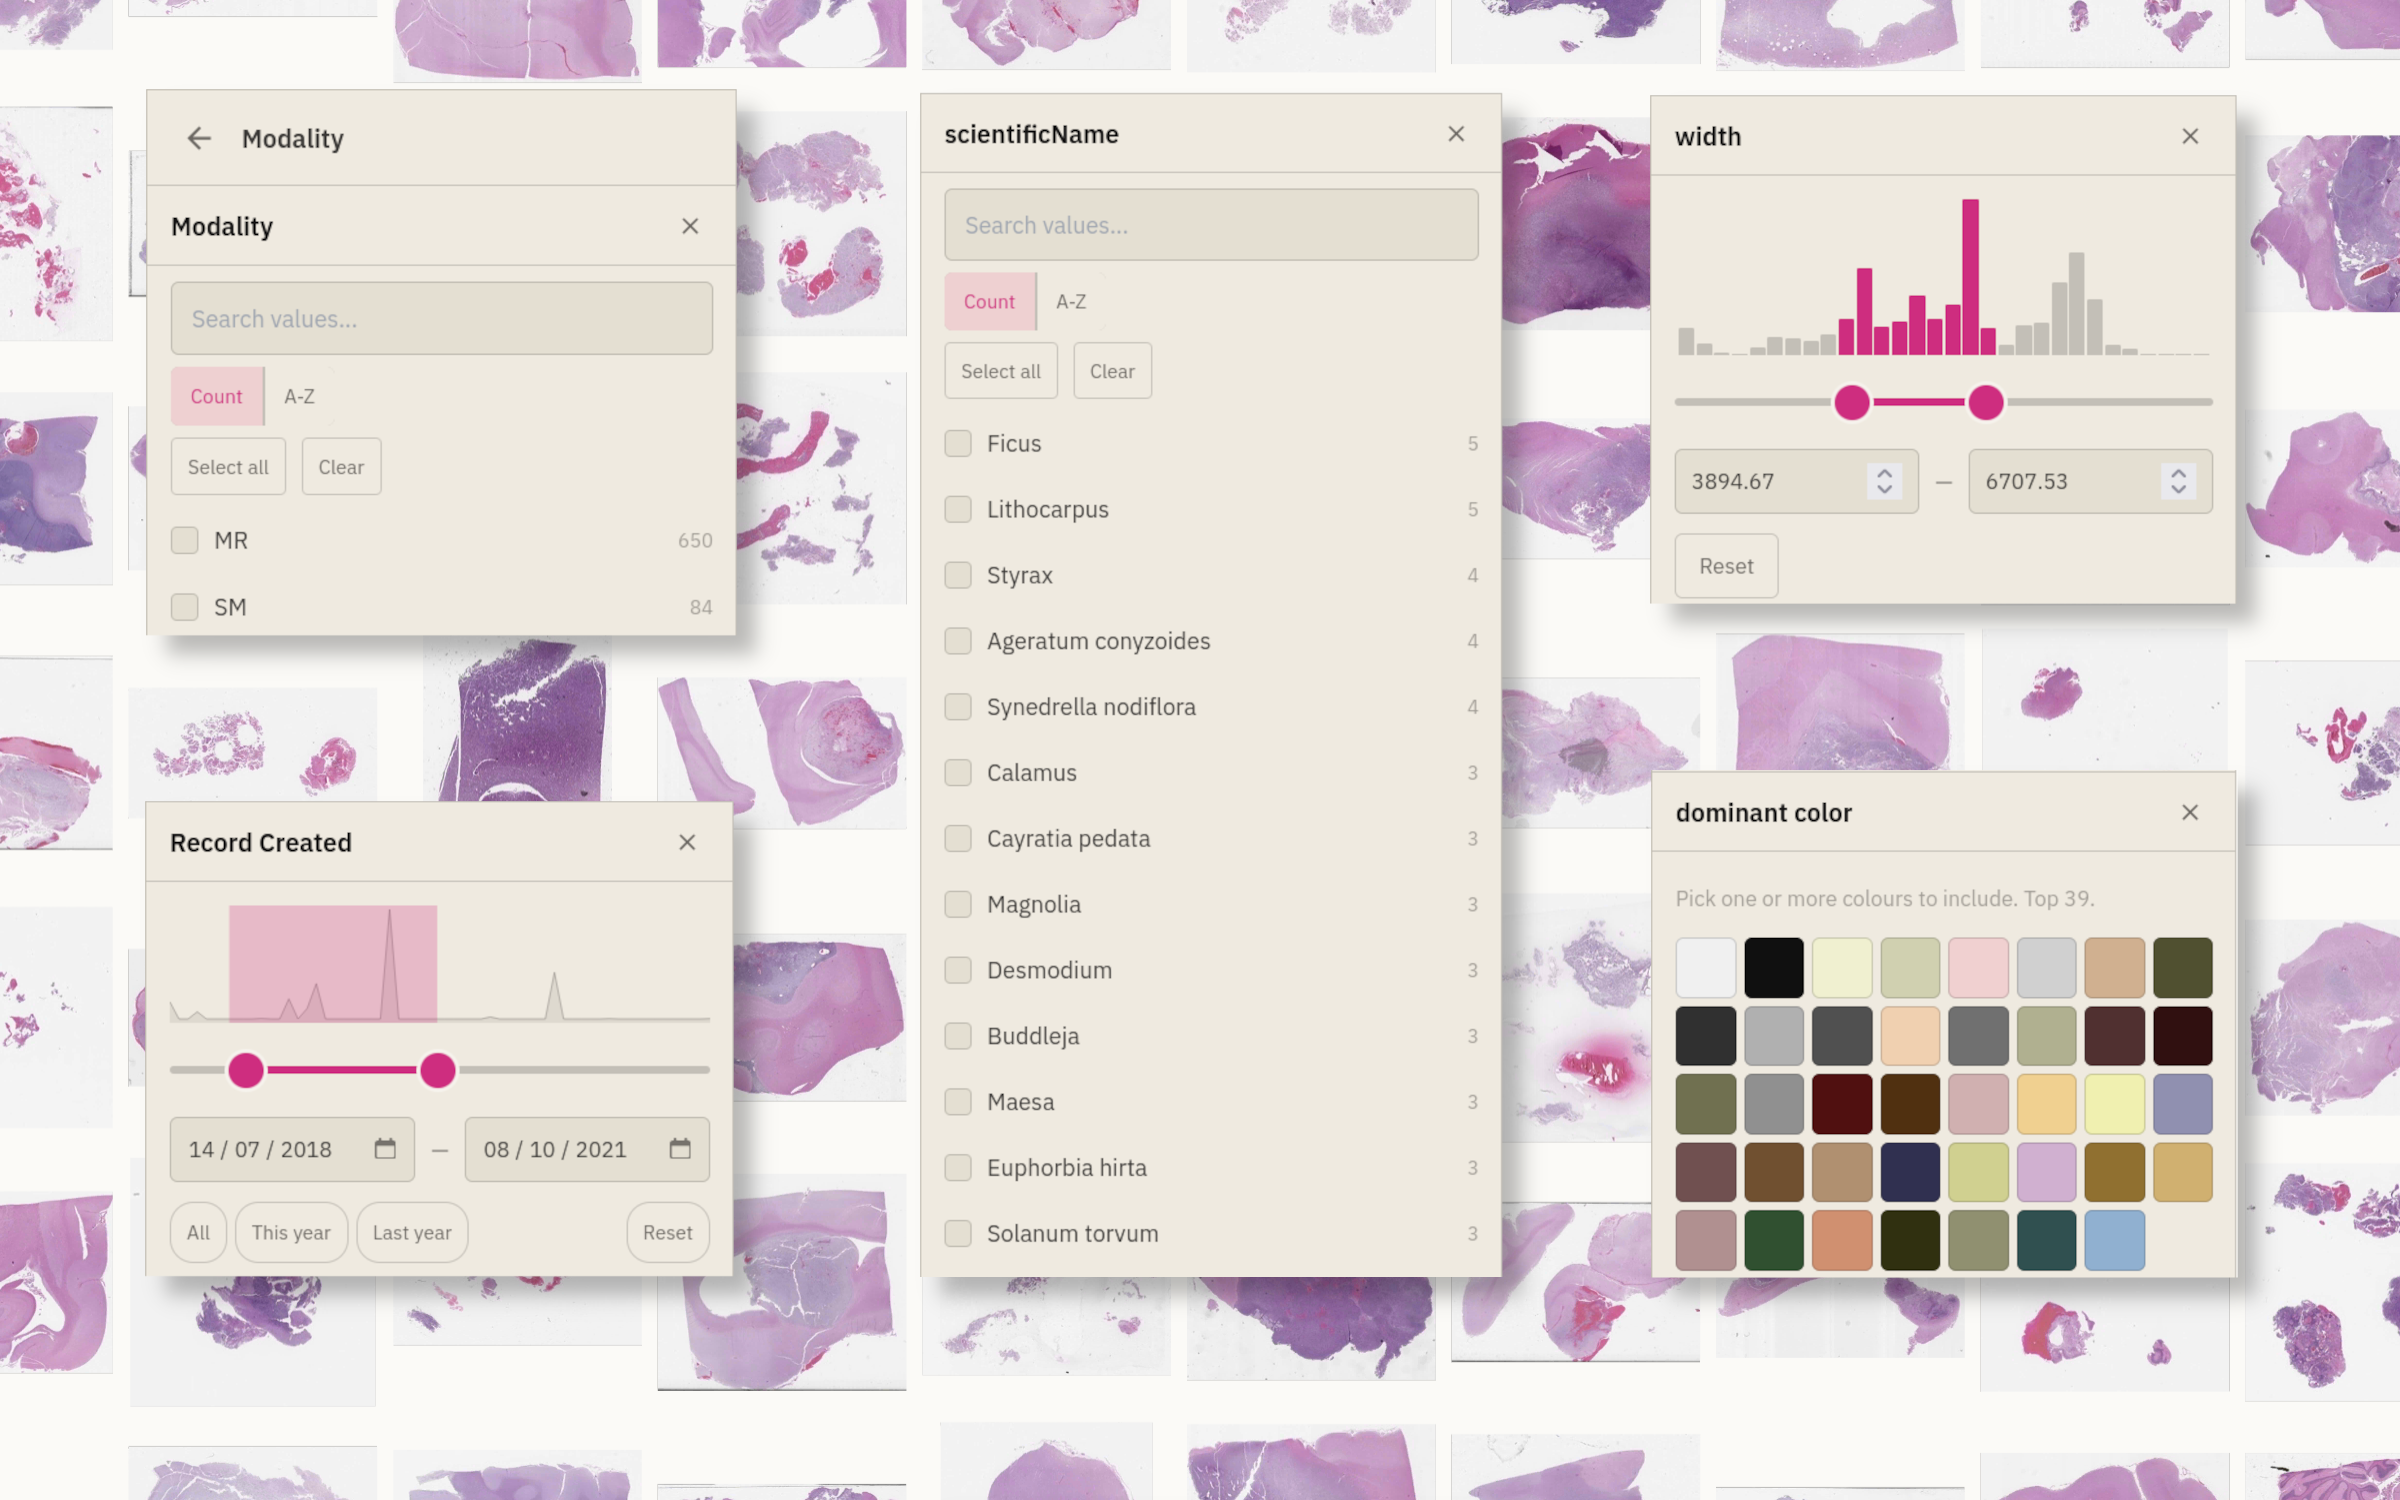
Metadata filtering
Every column is a filter. Every filter is live.
Combine numeric ranges, categorical selections, full-text search, and date ranges across any combination of fields. Every view updates simultaneously. No SQL, no query builder, no lag.
- Numeric ranges with distribution histograms
- Multi-select categorical facets
- Full-text search across any string column
- Date ranges with calendar and timeline scrubbing
- Nested AND/OR logic without writing a query
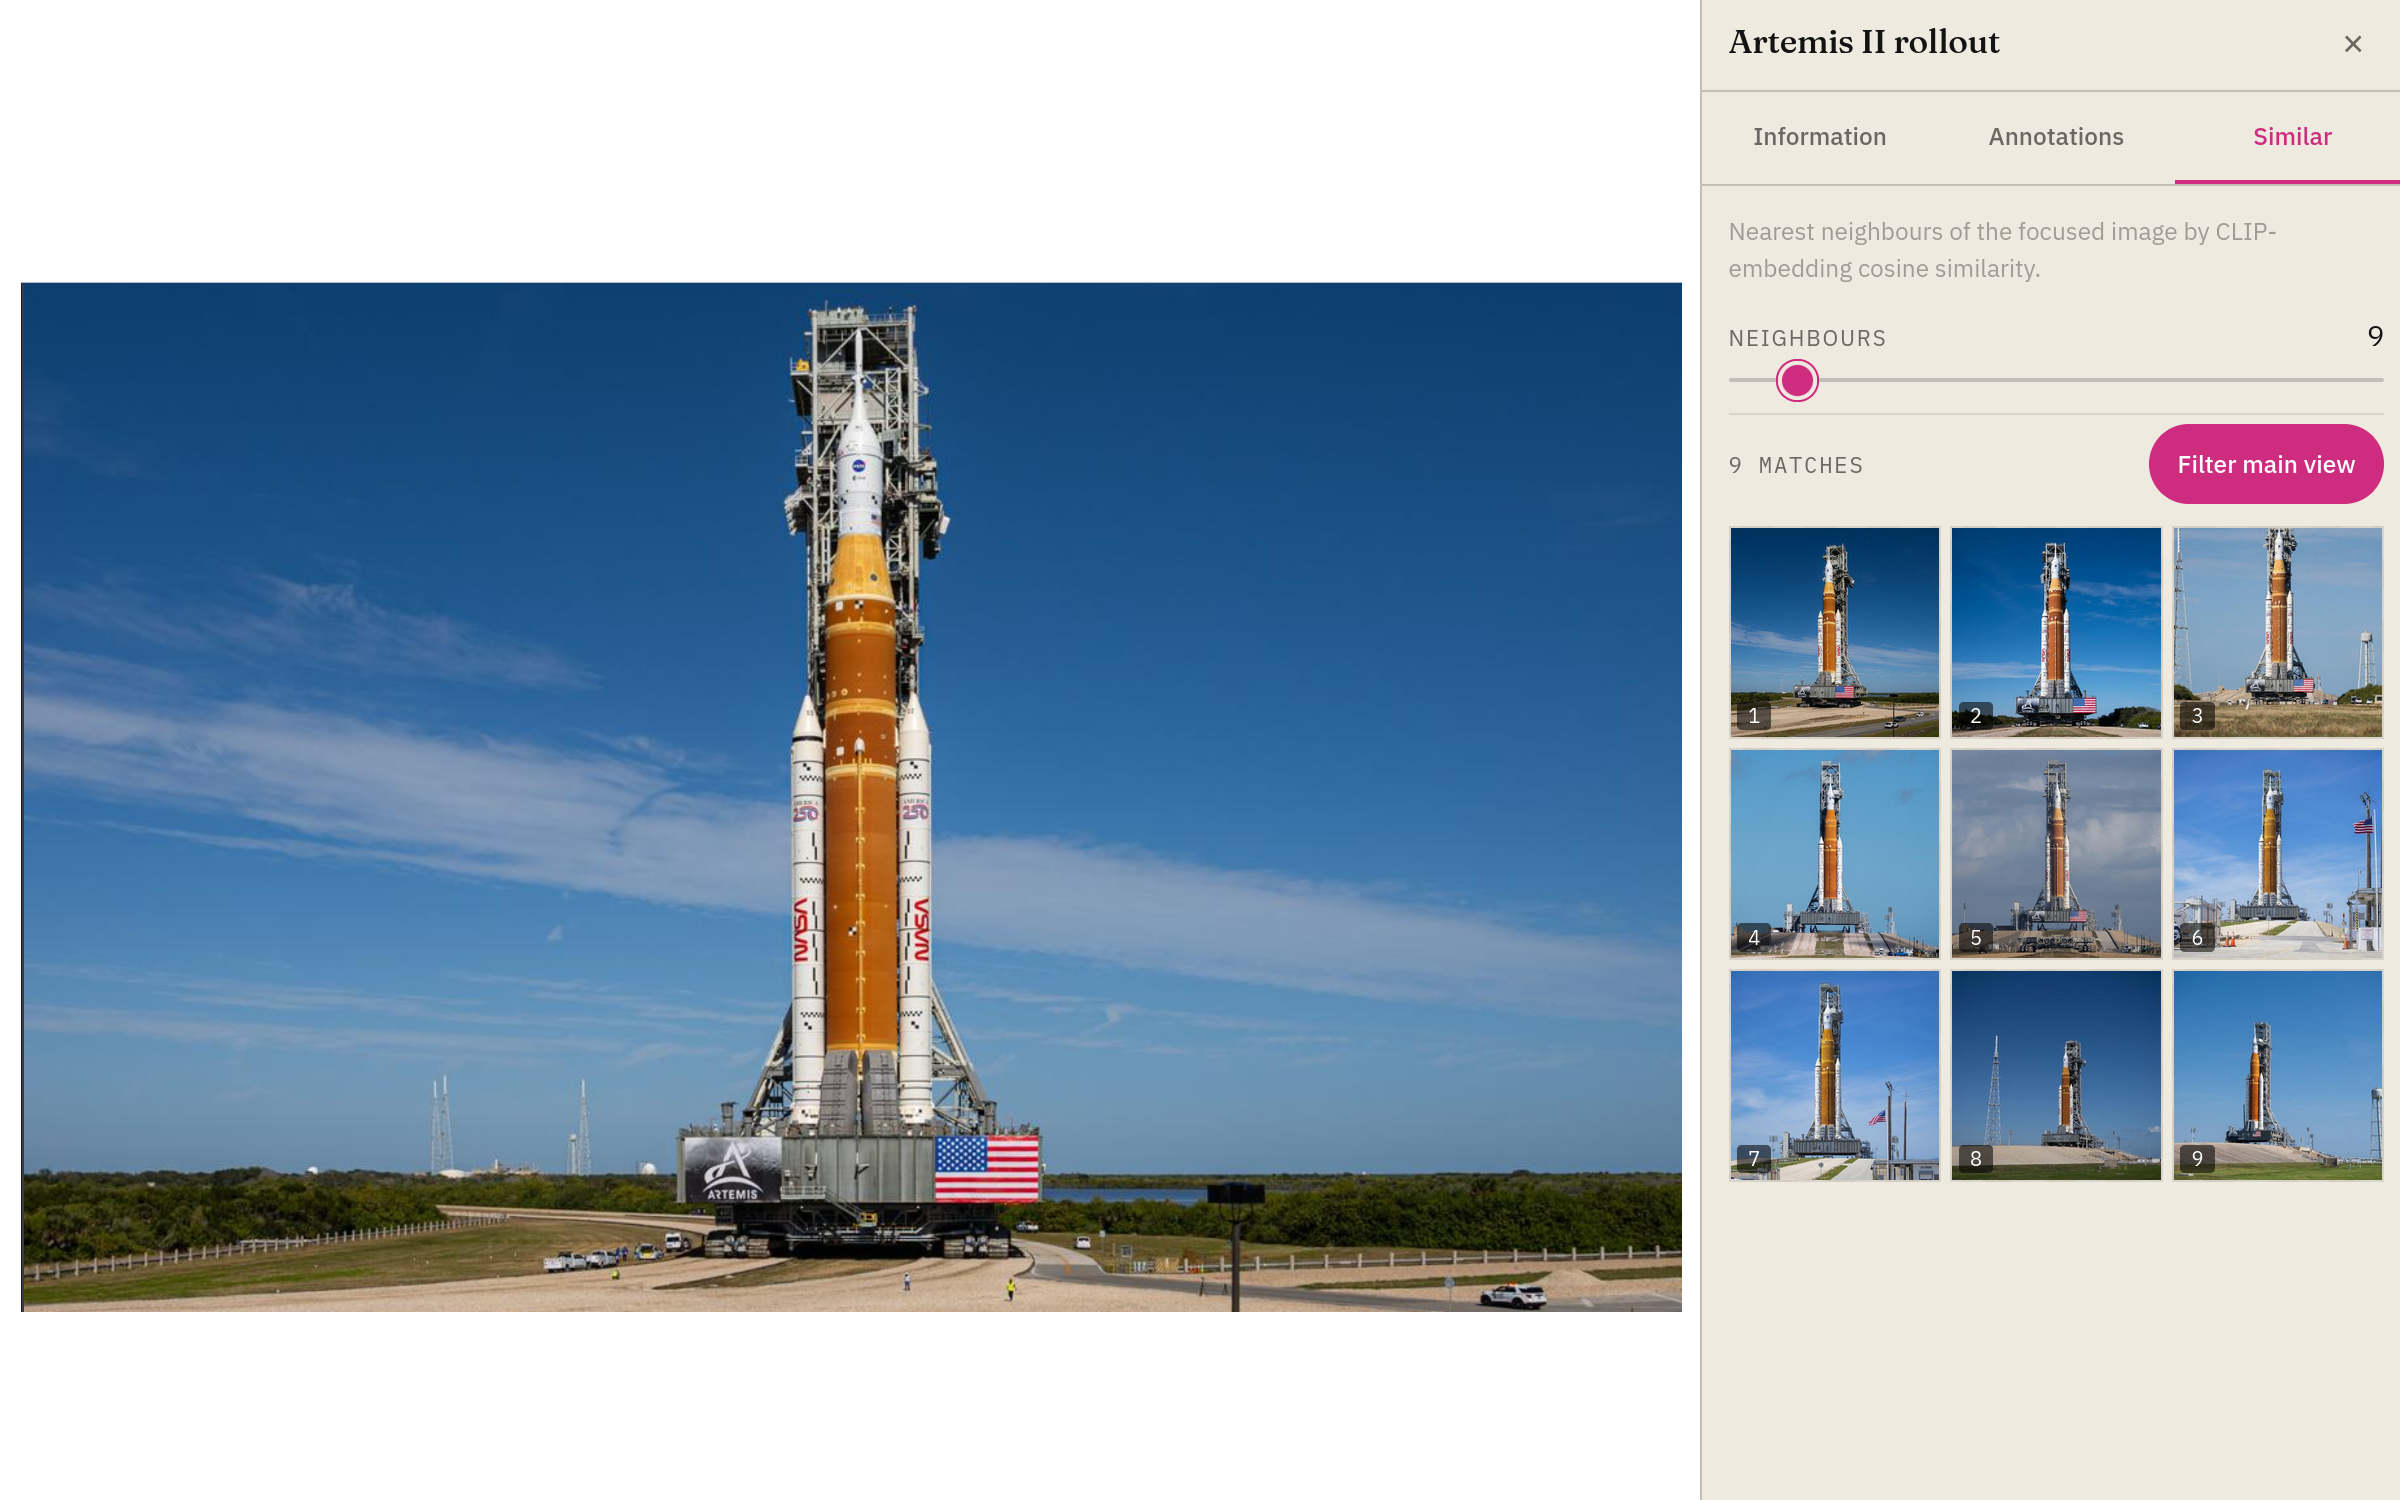
Visual similarity search
Find it by looking like it.
Click any image to surface visually similar records across your entire collection. Works on pretrained embeddings out of the box; bring your own model for domain-specific similarity. Invaluable for triage, duplicate detection, and hypothesis generation.
- Pretrained ViT & CLIP embeddings out of the box
- Bring your own embedding model via the SDK
- k-NN results ordered by cosine distance
- Cluster browsing — find groups, not just items
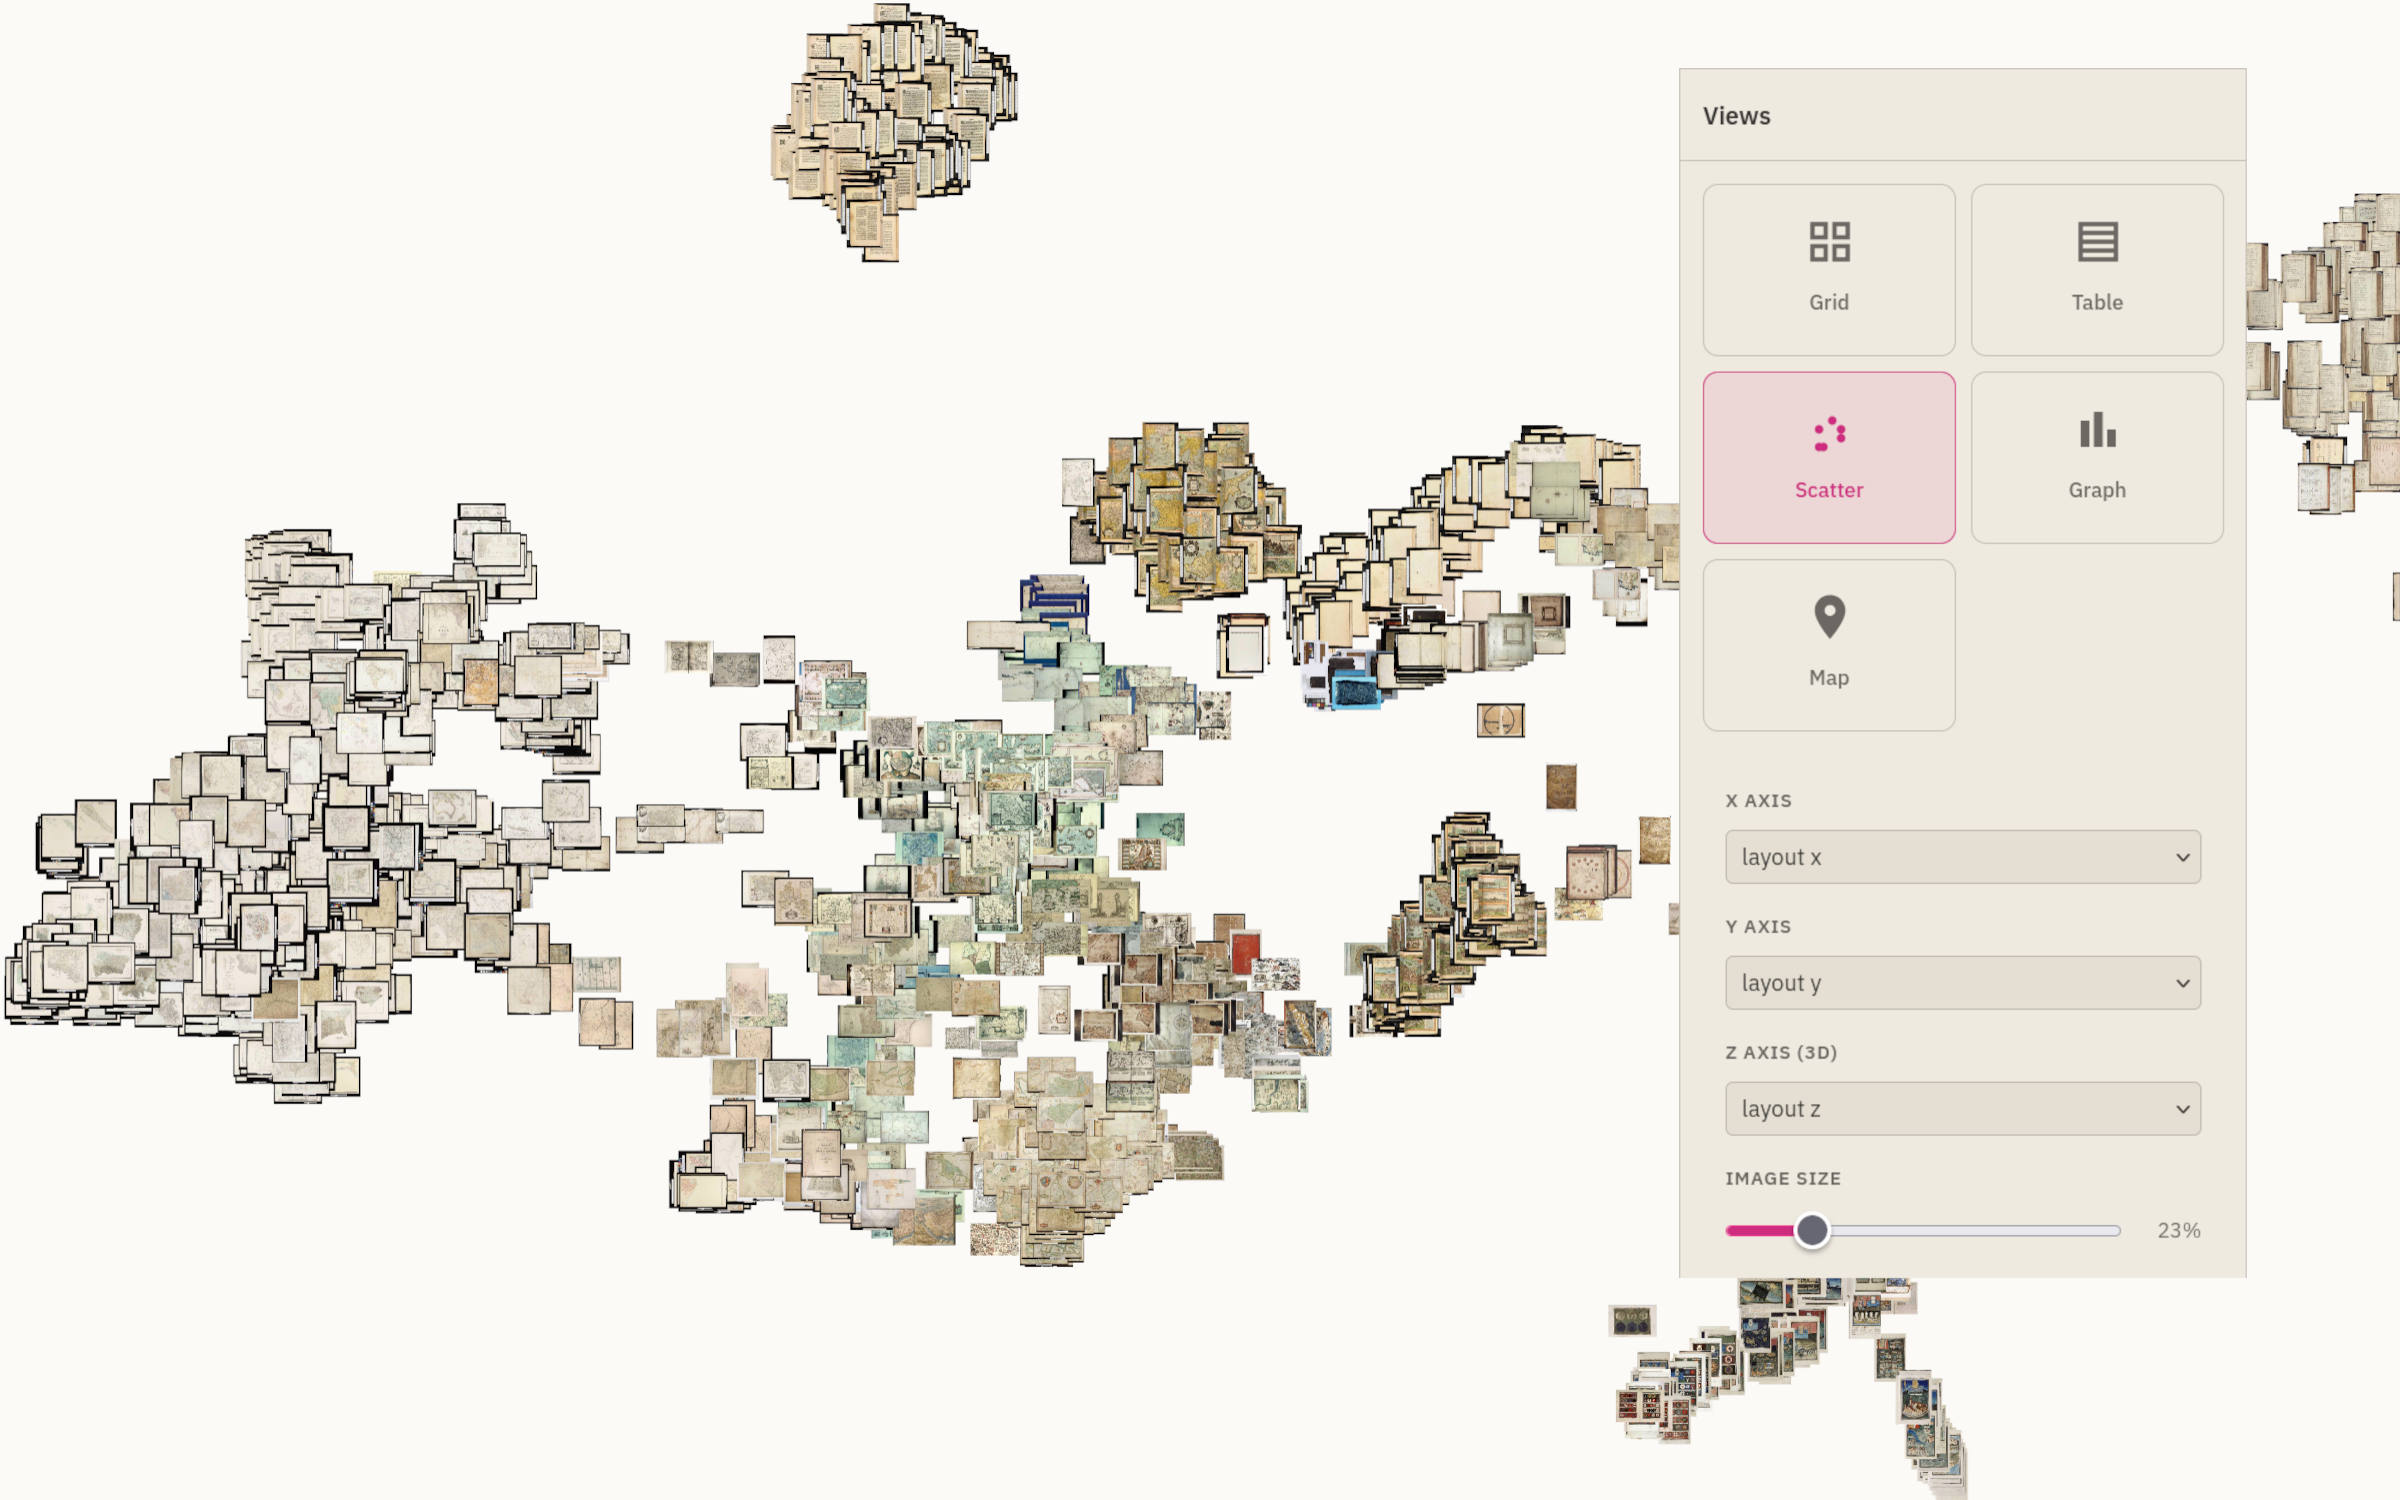
Scatter view on embeddings
See the shape of your data.
Project your embeddings into 2D with UMAP or t-SNE, then explore the scatter interactively. Every point is a thumbnail. Lasso-select clusters, inspect outliers, label structure that was invisible in the table.
- UMAP, t-SNE, and PCA projections
- Thumbnail-level rendering — 10⁶ points at 60fps
- Lasso, rectangle, and similarity-radius selection
- Colour by any metadata dimension
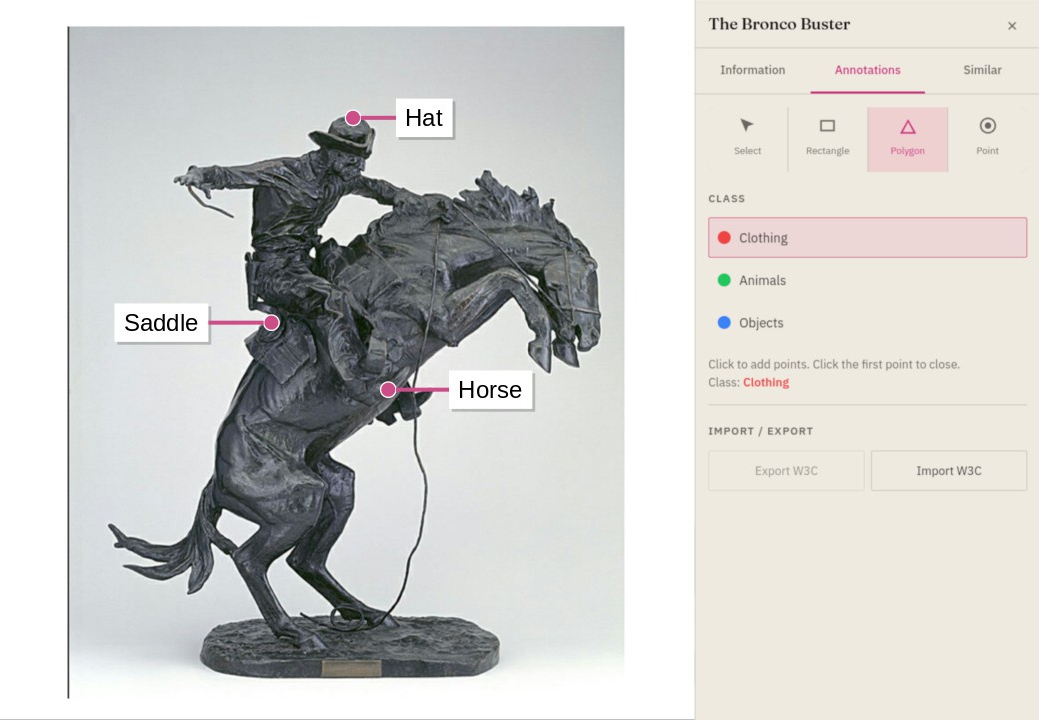
Annotations
Labels that travel with your data.
Tag, classify, and annotate records individually or in bulk. Annotations are first-class metadata — filterable, exportable, round-trippable. Collaborate on labelling with per-annotator provenance and conflict resolution.
- Bulk tag entire selections
- Bounding boxes, polygons, and point labels
- Per-annotator provenance & audit log
- Export as COCO, YOLO, or custom JSON
API & SDK
Programmable, end to end.
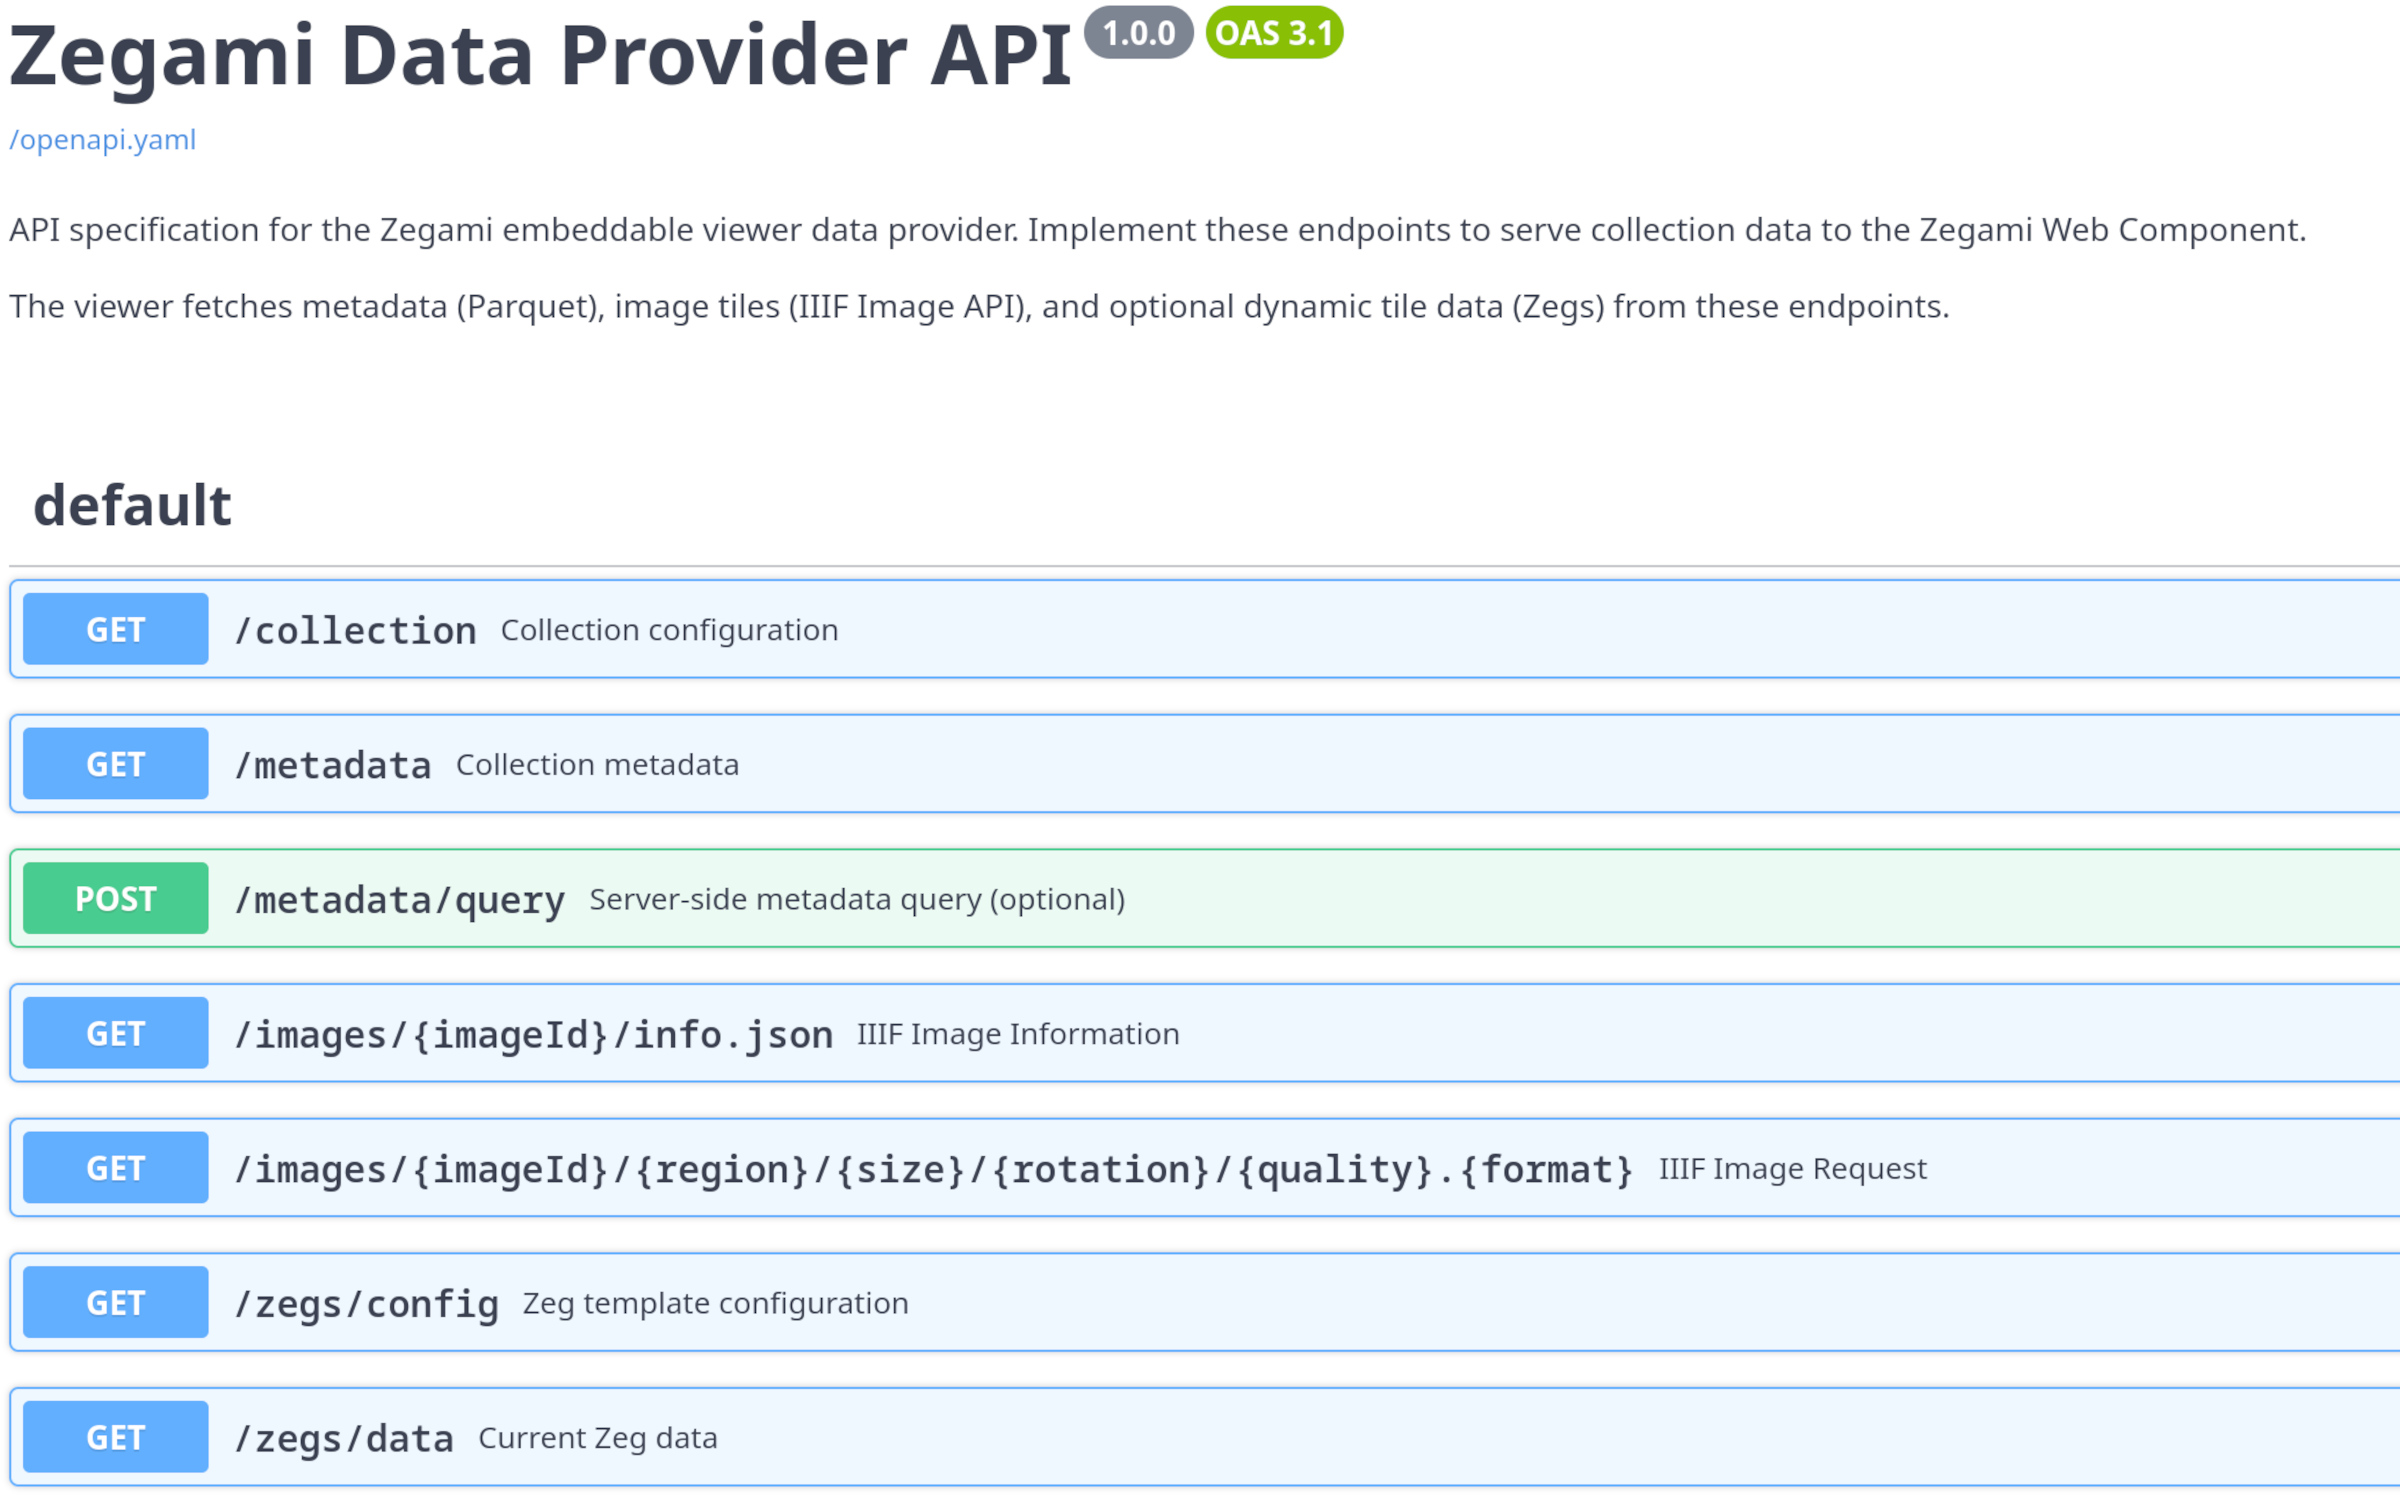
Everything you can do in the UI is also available via REST and a Python SDK. Script ingestion, export filtered subsets, automate labelling pipelines, embed views in notebooks or internal tooling.
- REST API with OpenAPI schema
- Python SDK with pandas + DuckDB interop
- Webhooks for ingest/annotation events
- Jupyter and notebook embeds
Integrations
Fits your stack.
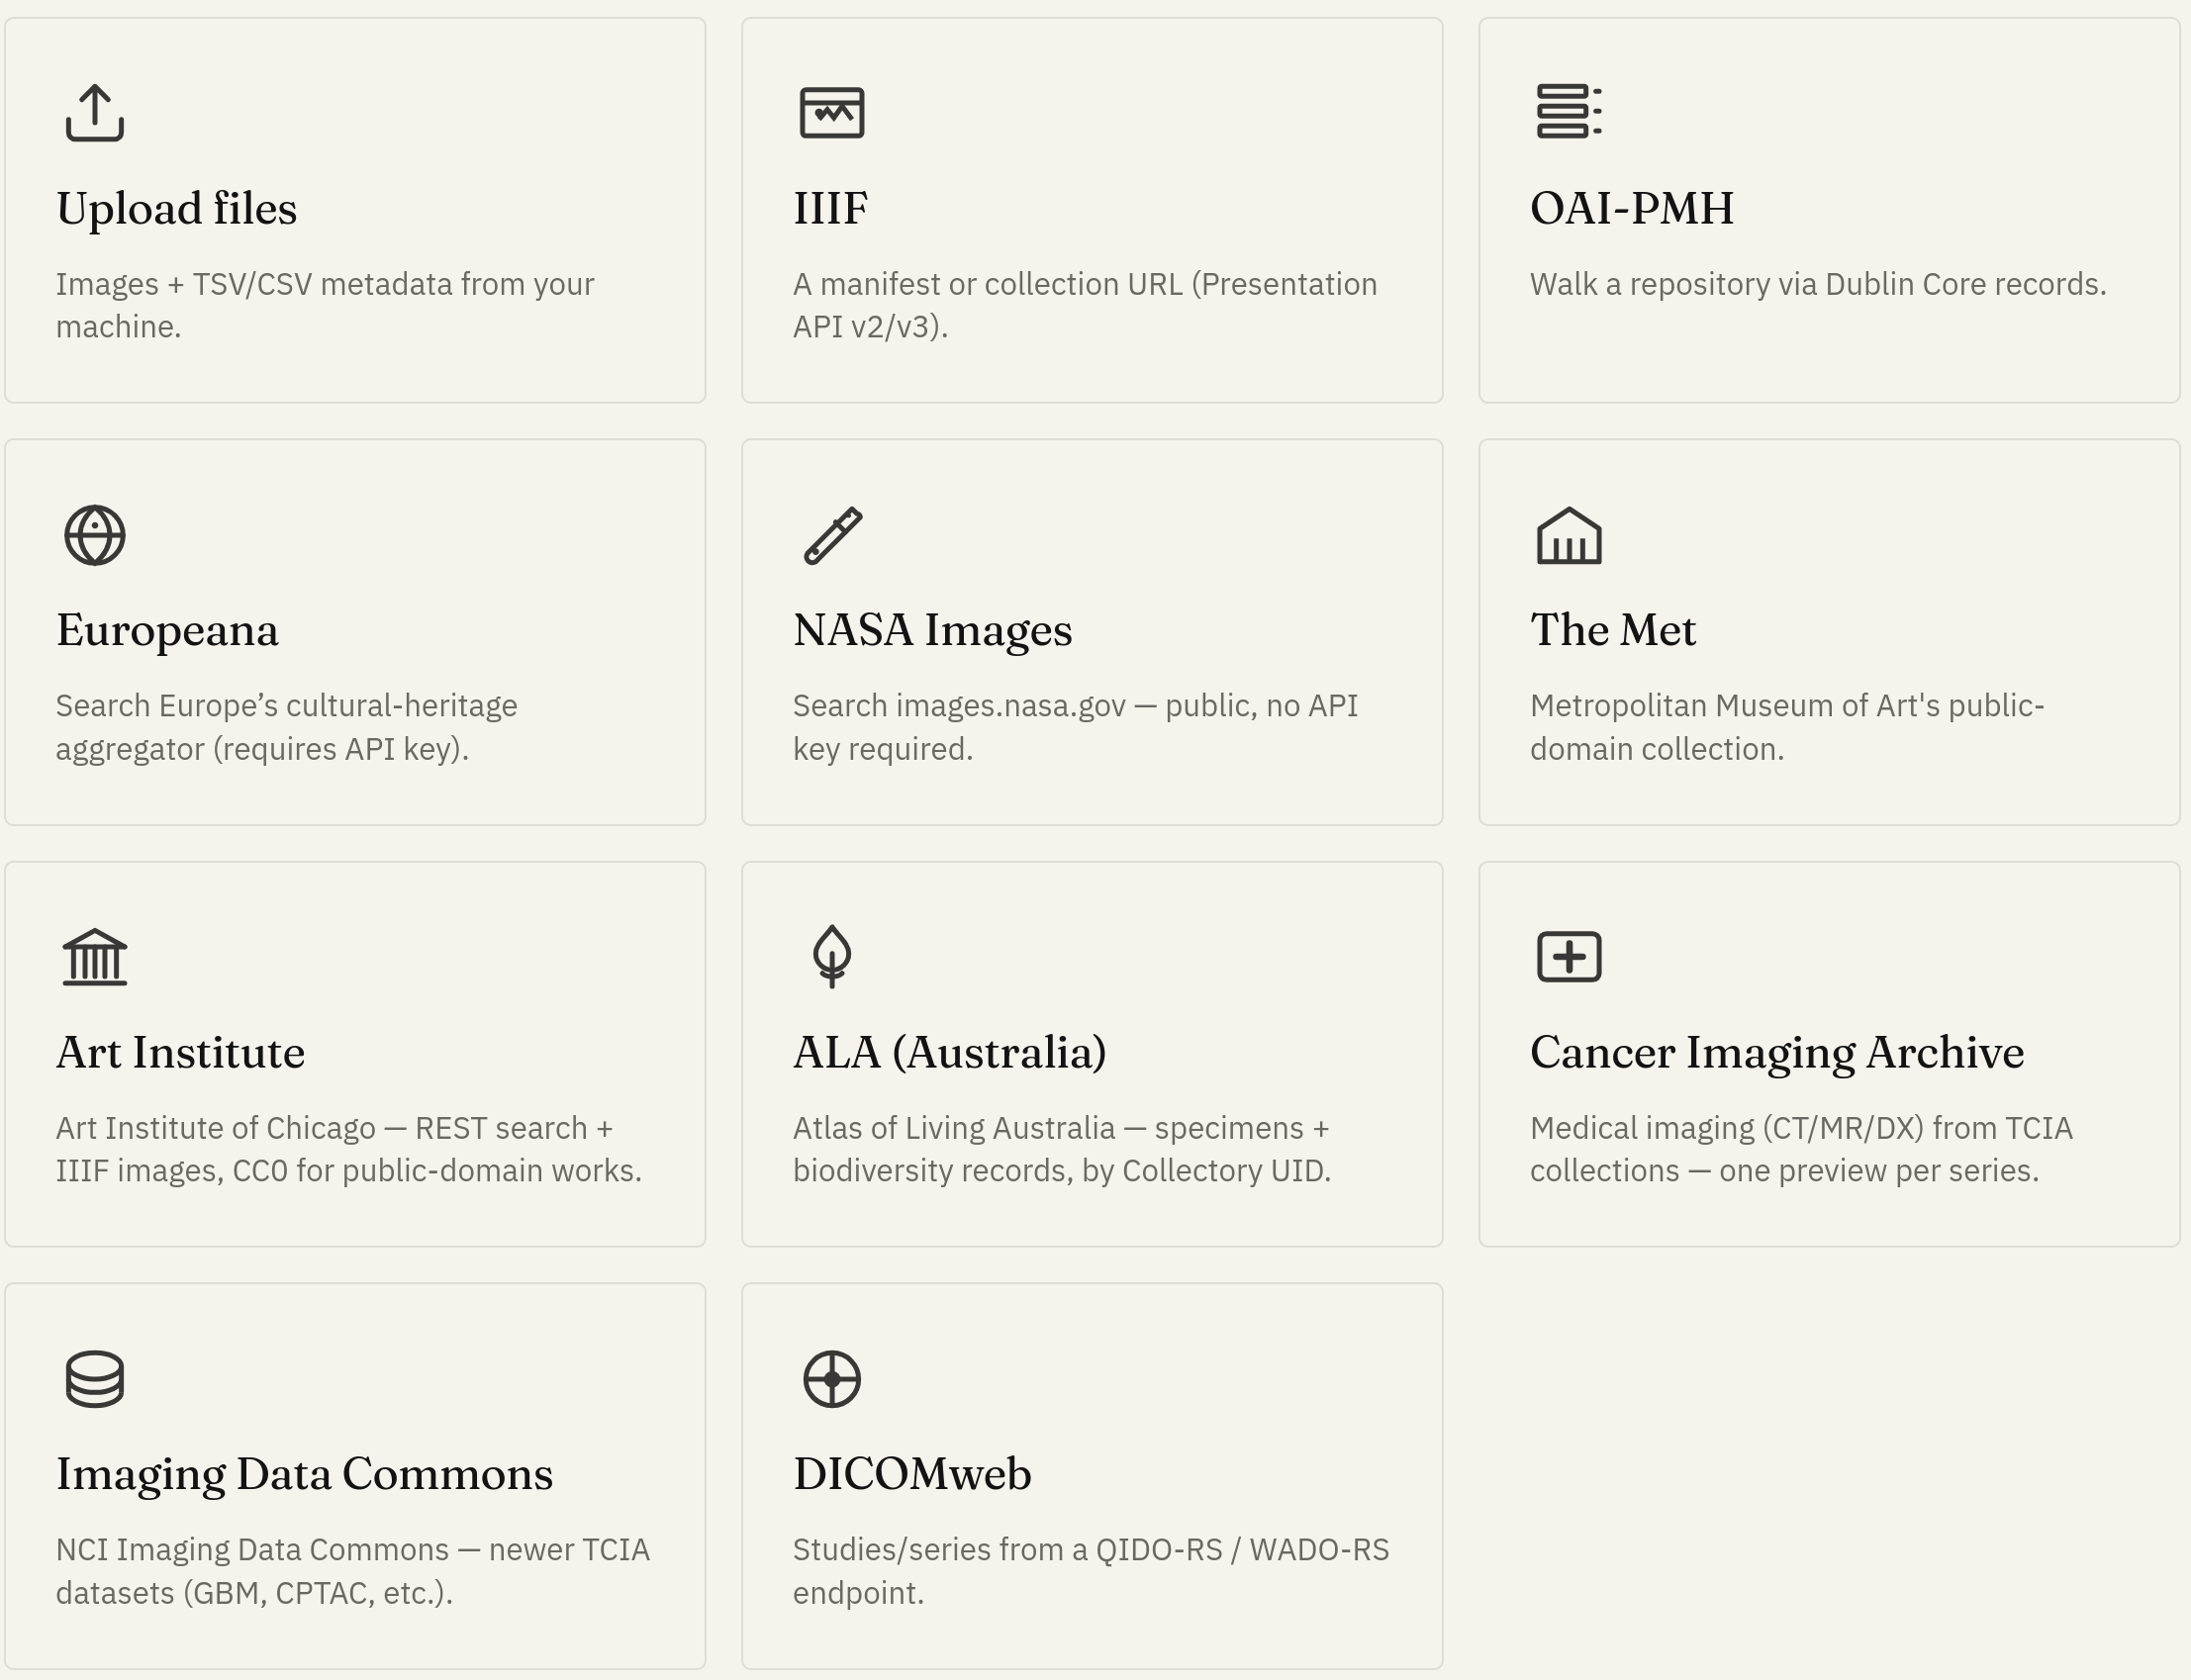
Connect to object stores (S3, Azure Blob, GCS), IIIF, DICOM, SharePoint. Push selections to Slack or email. Stream annotations into training pipelines. Deploy on-prem, in your VPC, or managed.
- S3 / Azure Blob / GCS ingest
- IIIF & DICOM for heritage and medical
- Slack + Teams notifications
- On-prem, VPC, or SaaS deployment
See it on your data.
Fifteen-minute setup. Works on your existing spreadsheets, image folders, and S3 buckets.