Exploring data
Viewing collections
The viewer is where you actually explore a collection. This guide covers moving around the grid, the view types, selecting images, and the Inspector panel.
Last updated 2026-05-29
The layout
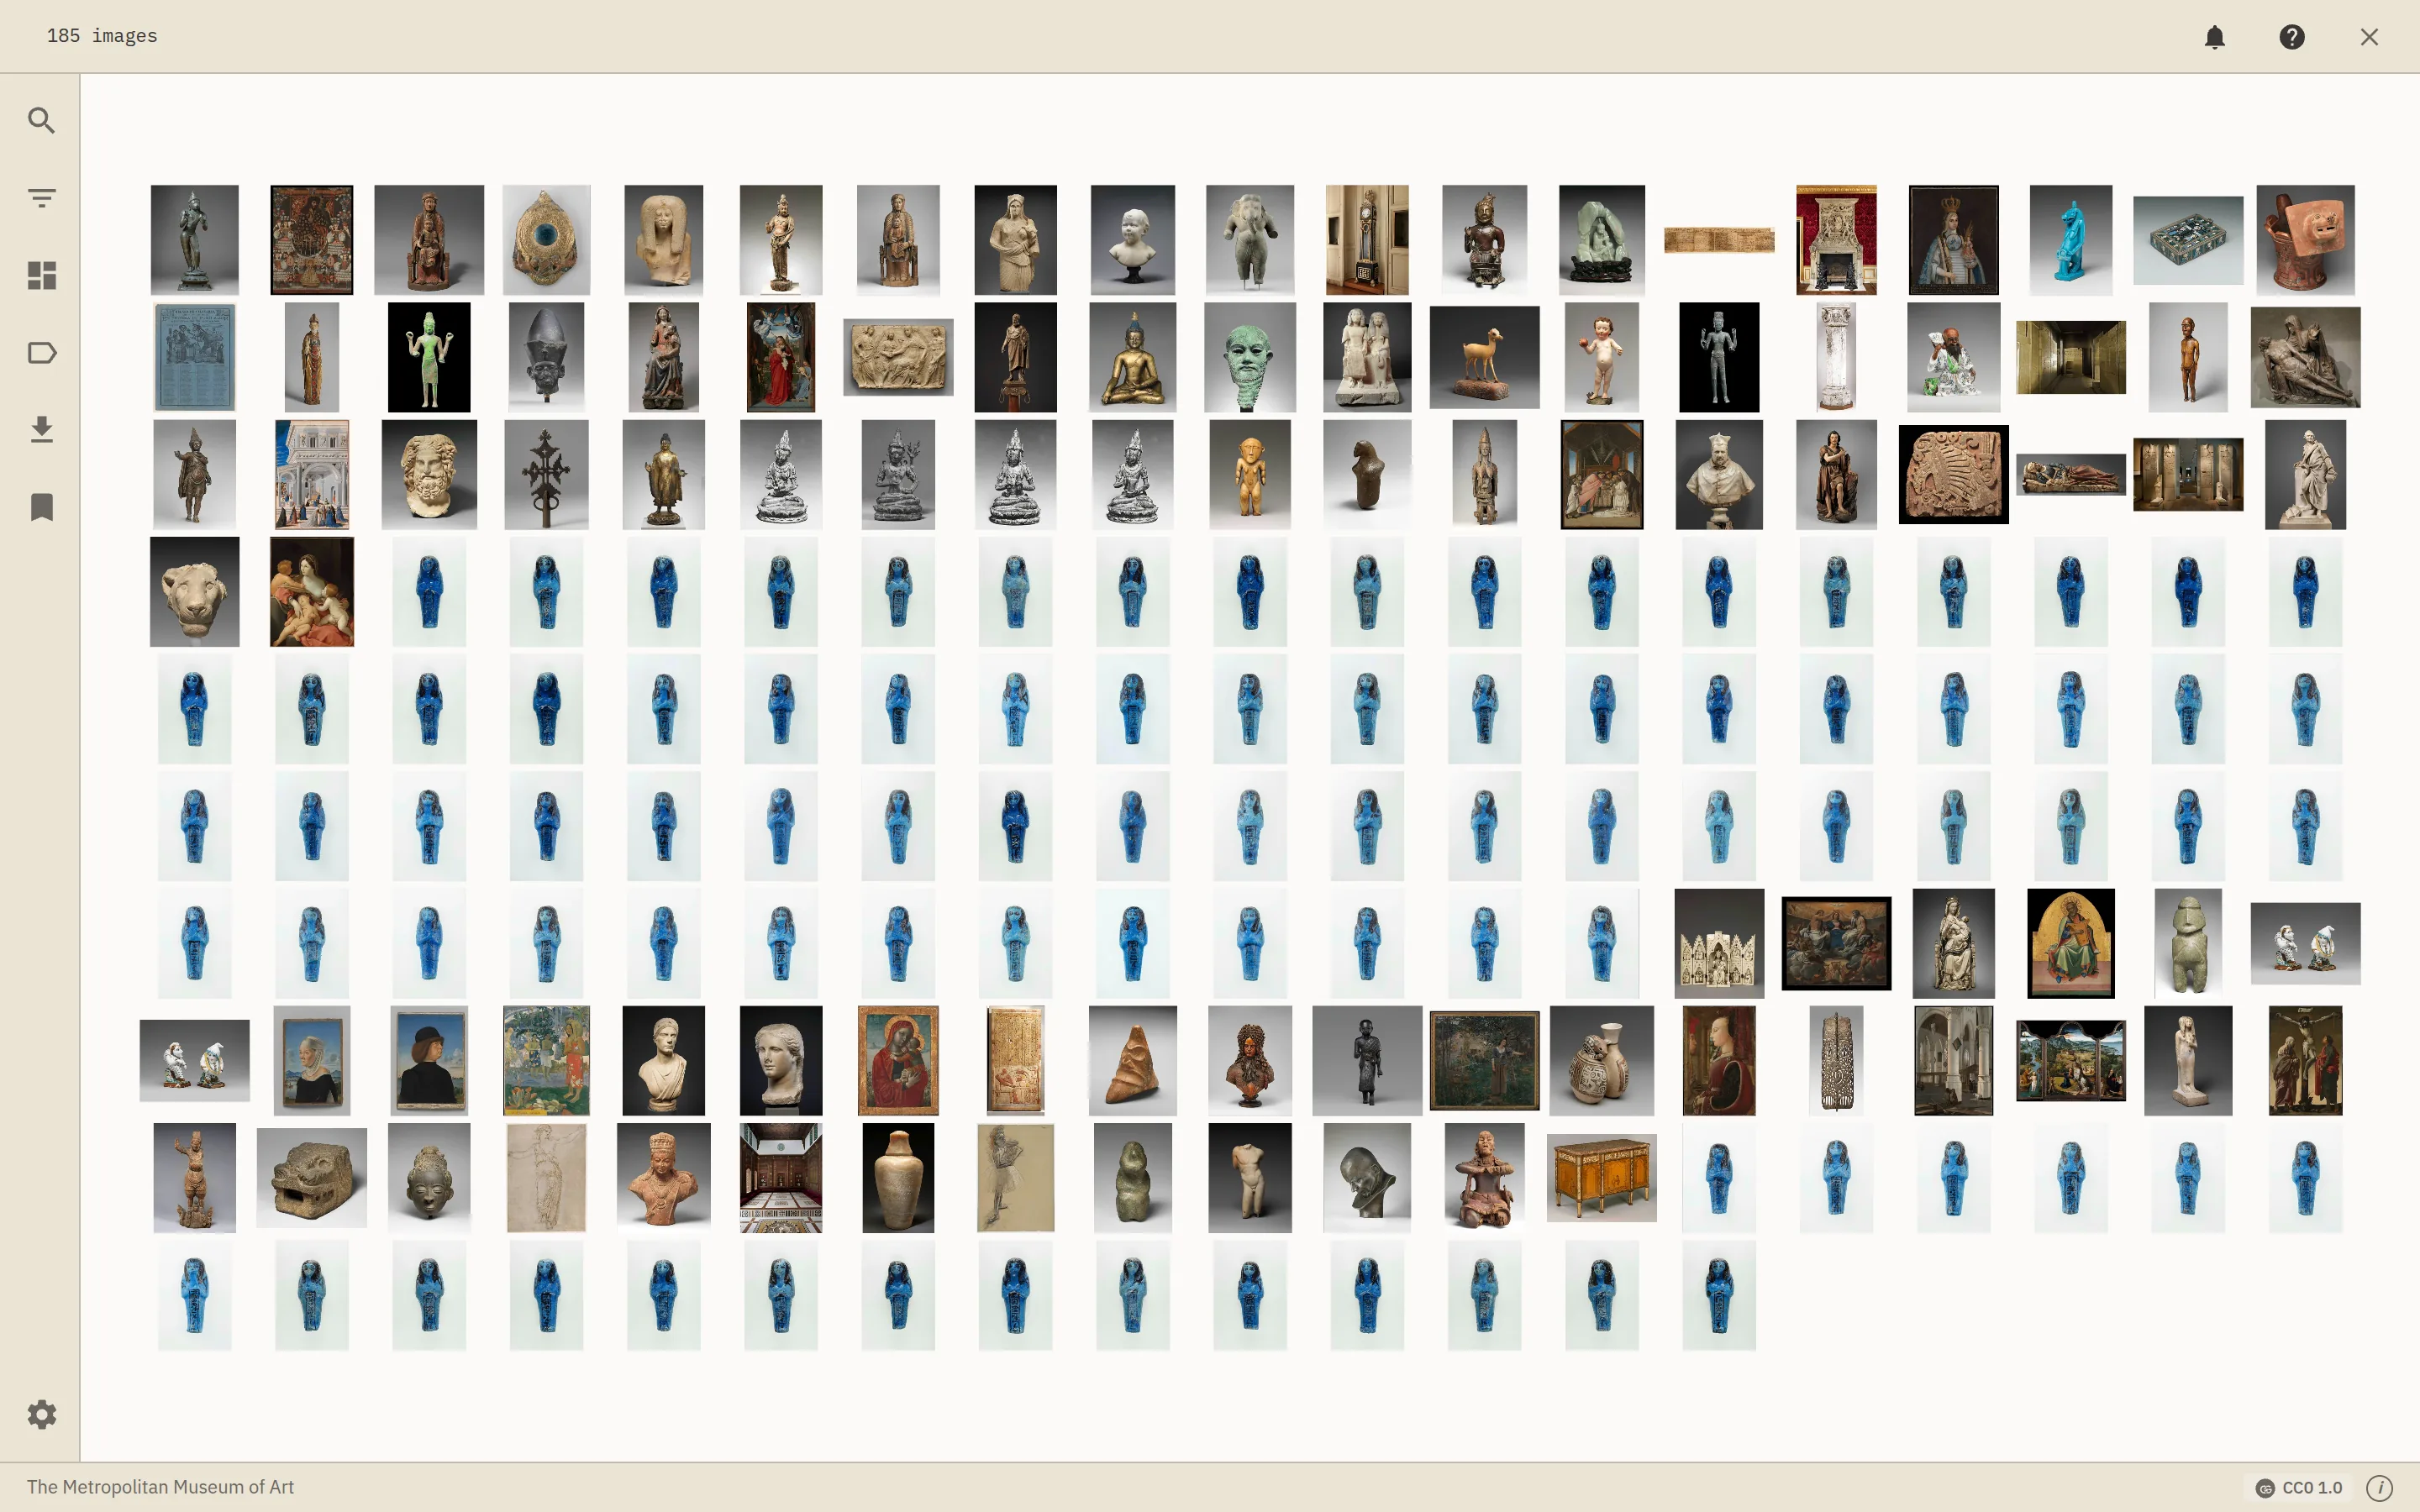
The viewer has three regions:
- A vertical toolbar down the left edge — one icon per panel.
- The canvas in the middle — the grid (or scatter, map, etc.).
- The Inspector on the right — opens when you click an image.

Moving around
- Pan by dragging the canvas; zoom with the scroll wheel or trackpad pinch.
- Press a tile to focus it (opens the Inspector); arrow keys then move focus tile-to-tile, Enter zooms in, Escape resets.
- The grid handles very large collections — hundreds of thousands of images — by streaming tiles as you move.
View types
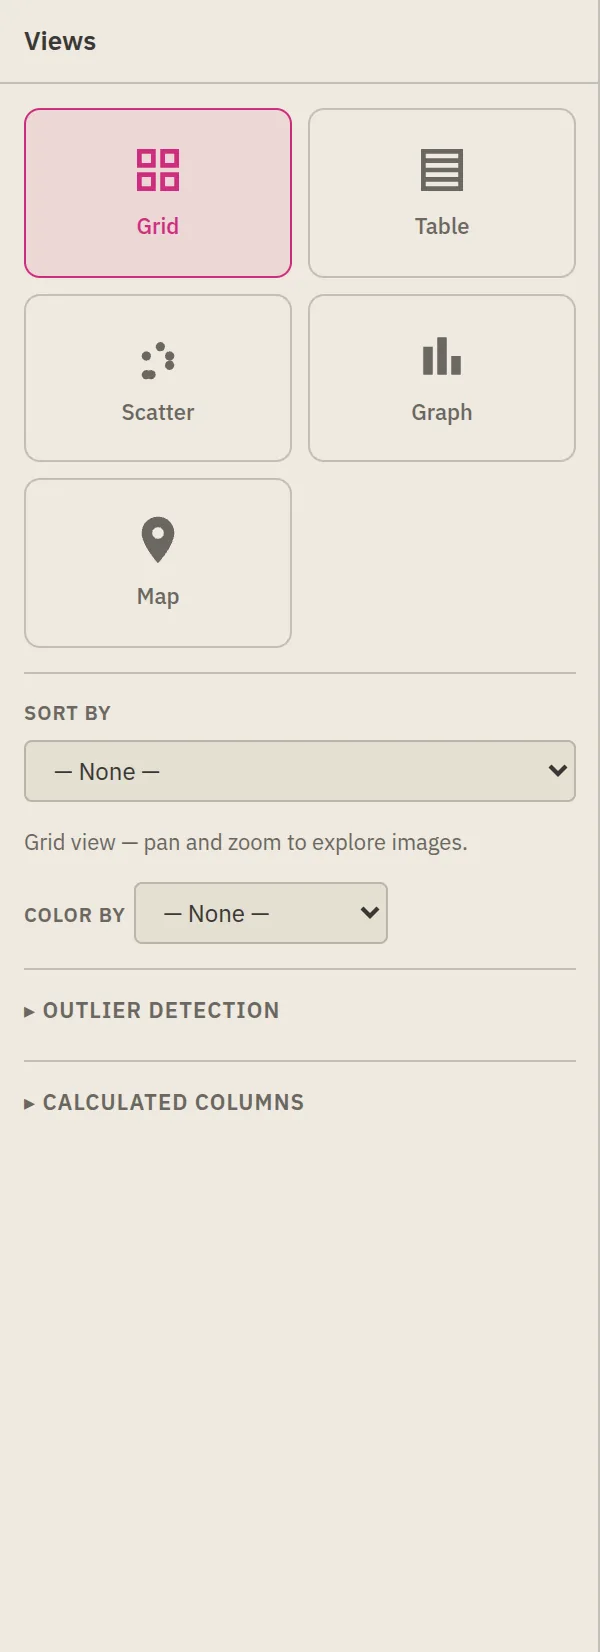
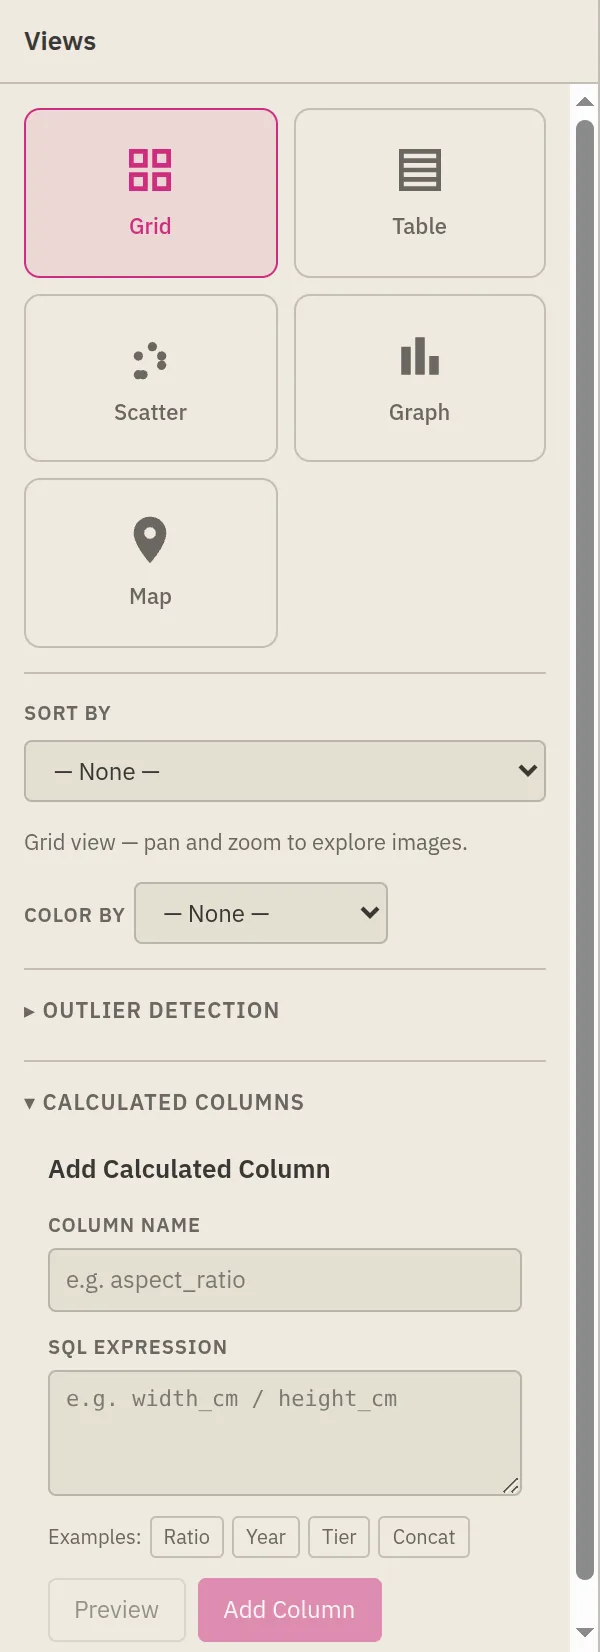
Open the Views panel from the toolbar to switch how the data is drawn. The same panel carries the controls shared across views — Sort by (column + direction), Colour by (heatmap a numeric column: TDA, visual features, or any of your own), and Outlier detection.
Grid
The default. Every image is a tile; pan and zoom to scan the whole collection and spot visual patterns. Sorting and colouring reflow the tiles.
Table
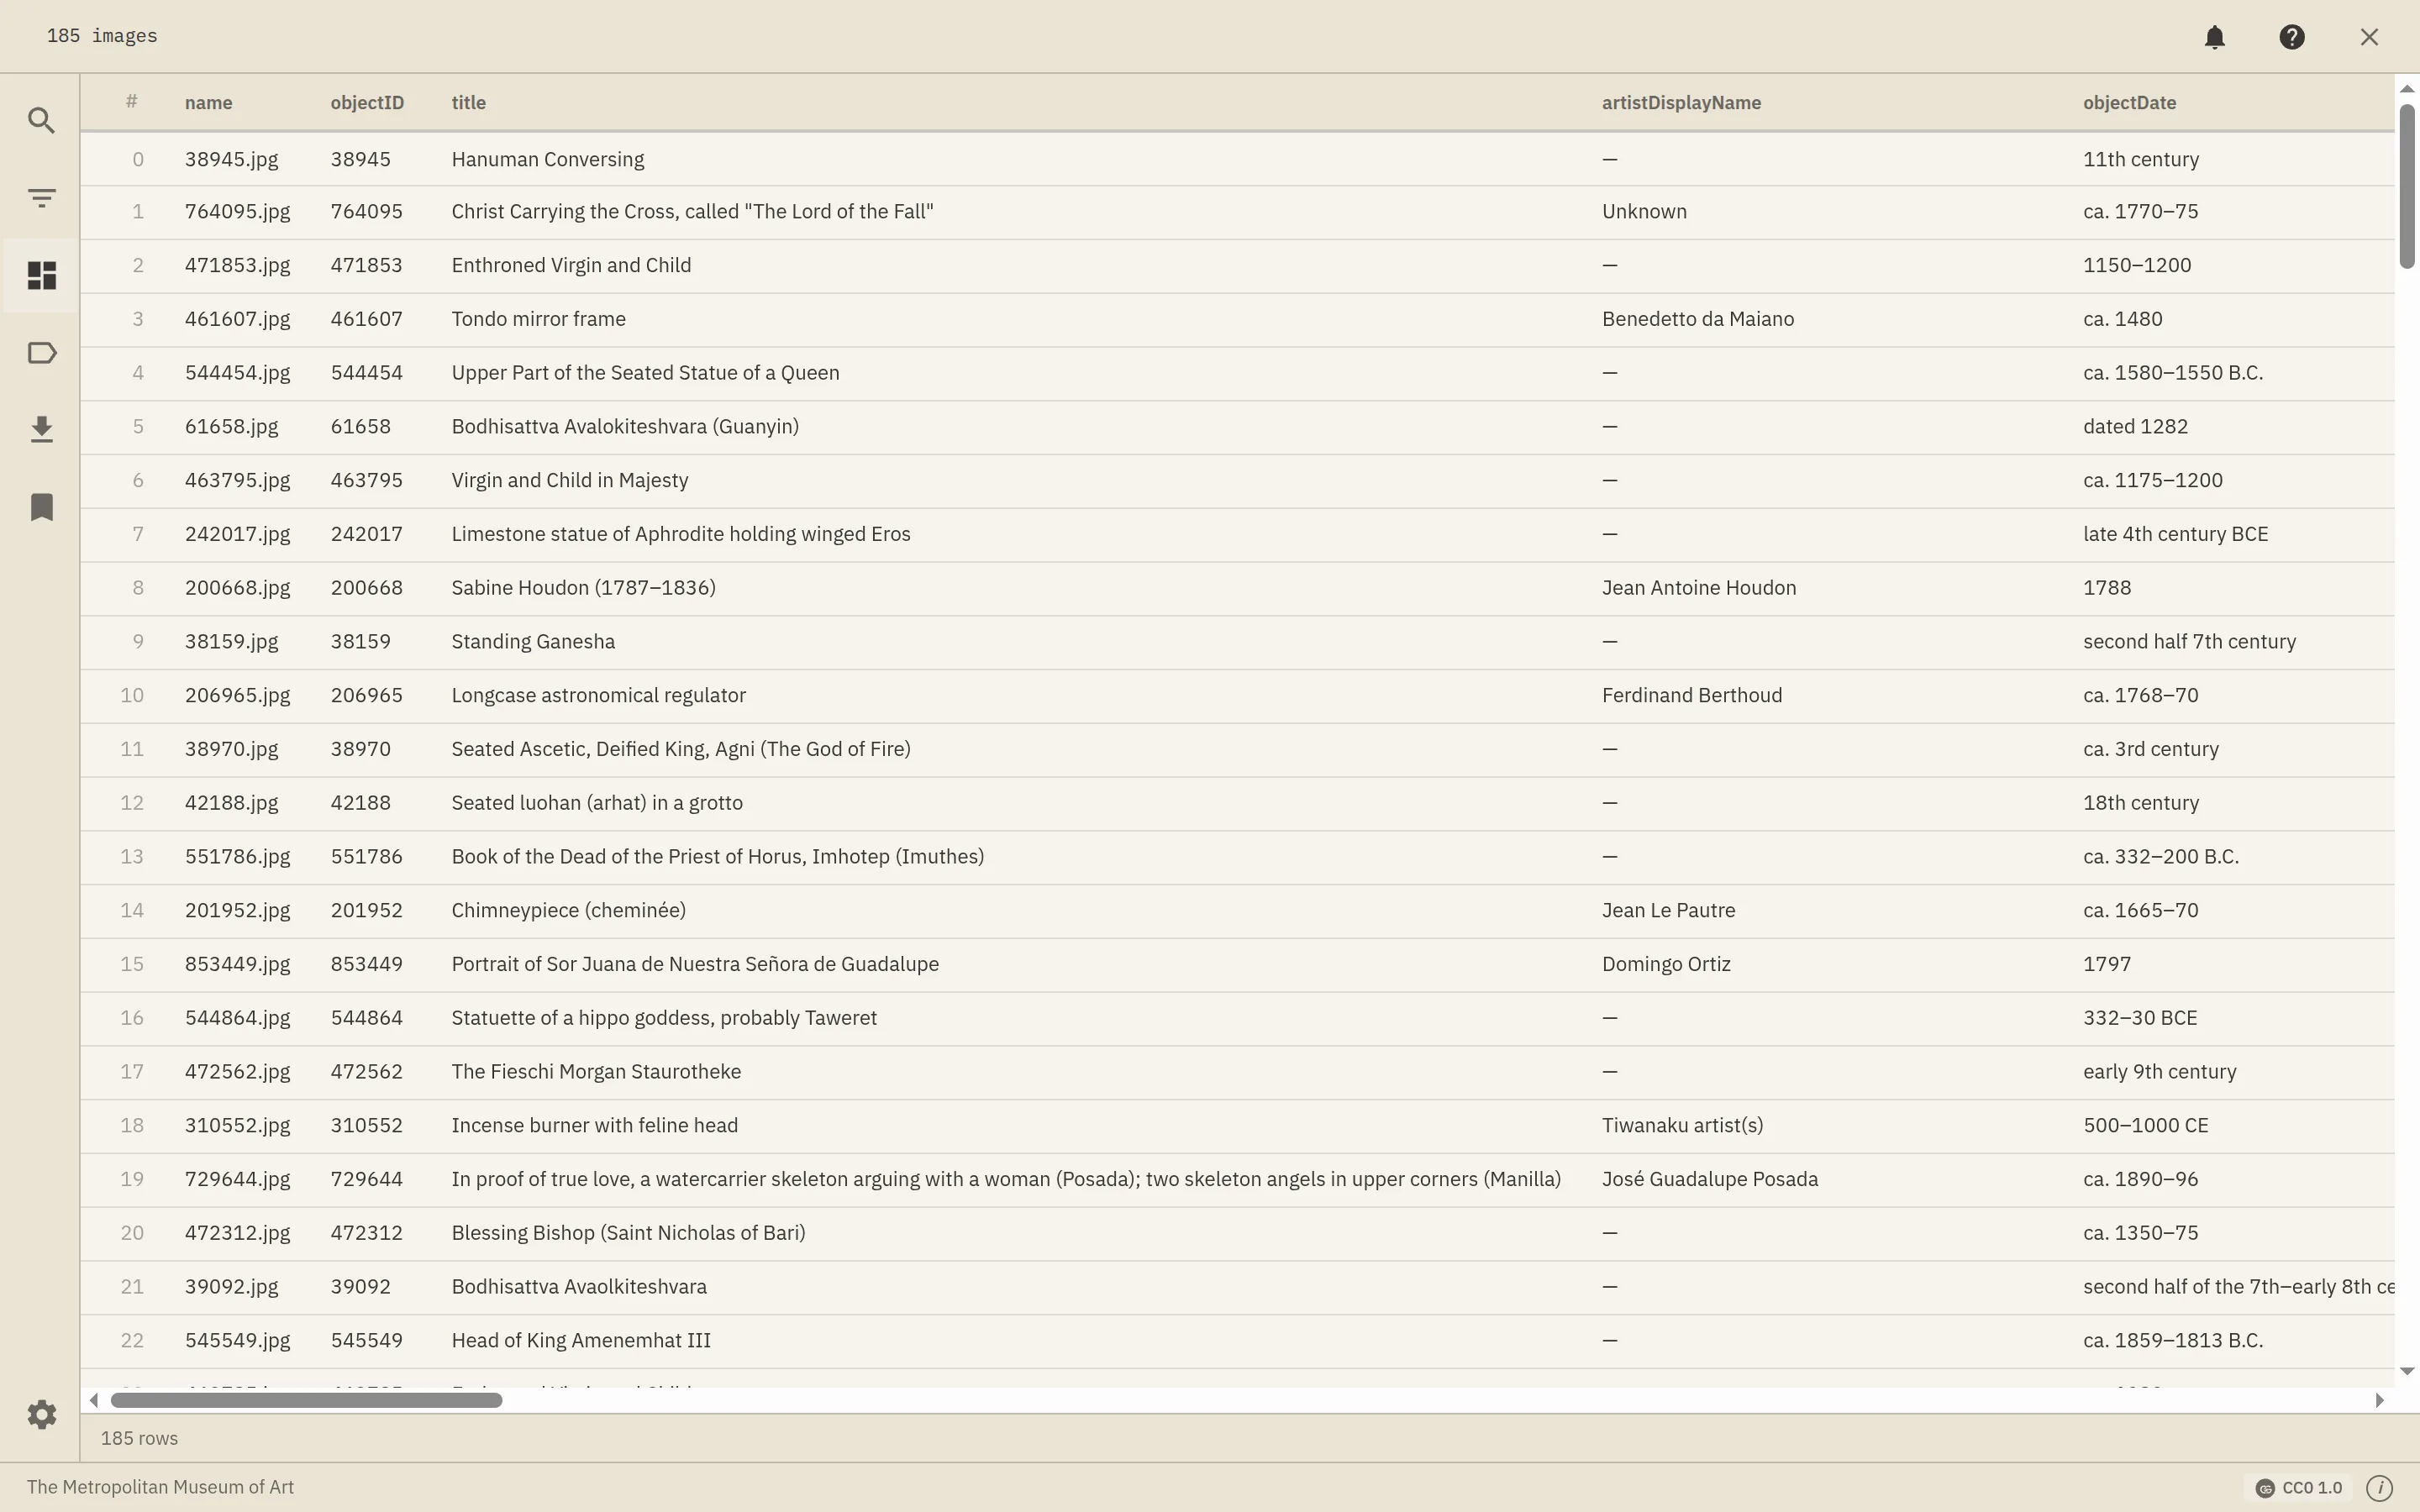
A spreadsheet of the metadata — sortable, resizable columns with virtual scrolling so it stays smooth on collections with millions of rows. Best when you want to read or compare the values behind the images.
Scatter
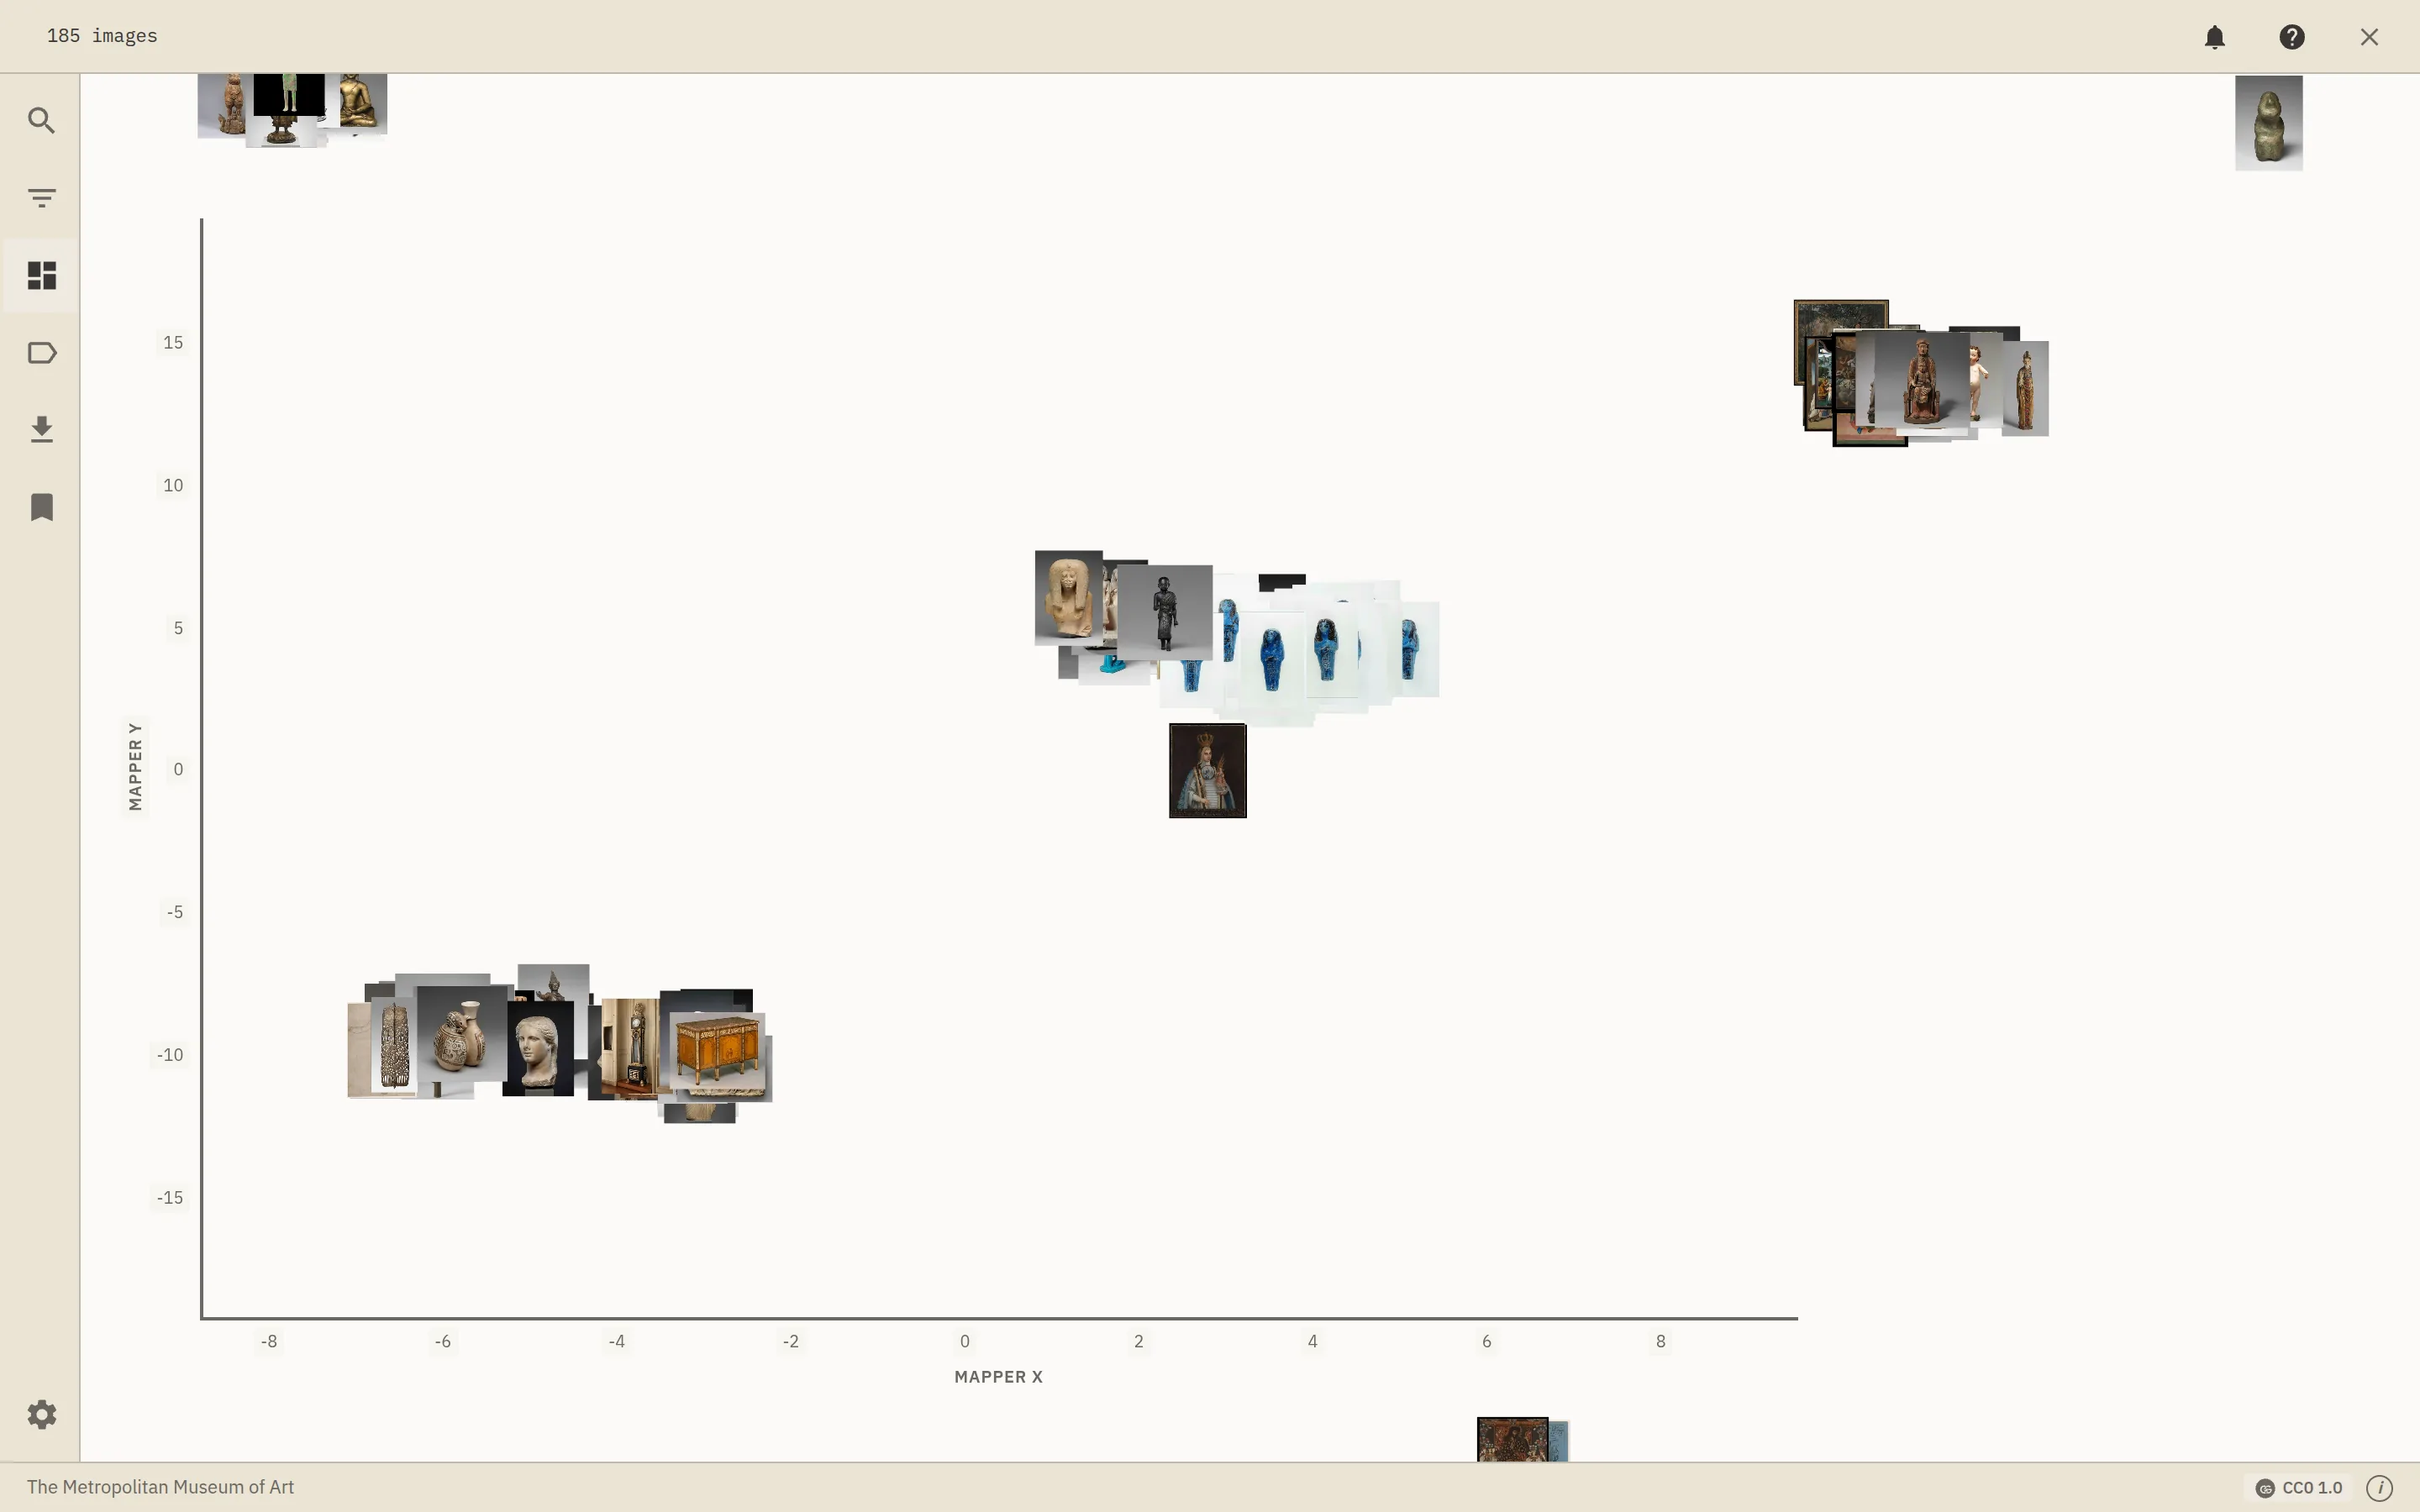
Plots each image by two numeric columns (2D) or three (3D), with axis selectors on the canvas. Point it at a UMAP embedding (turn it on in Processing & analysis) and visually similar images cluster together.
Graph
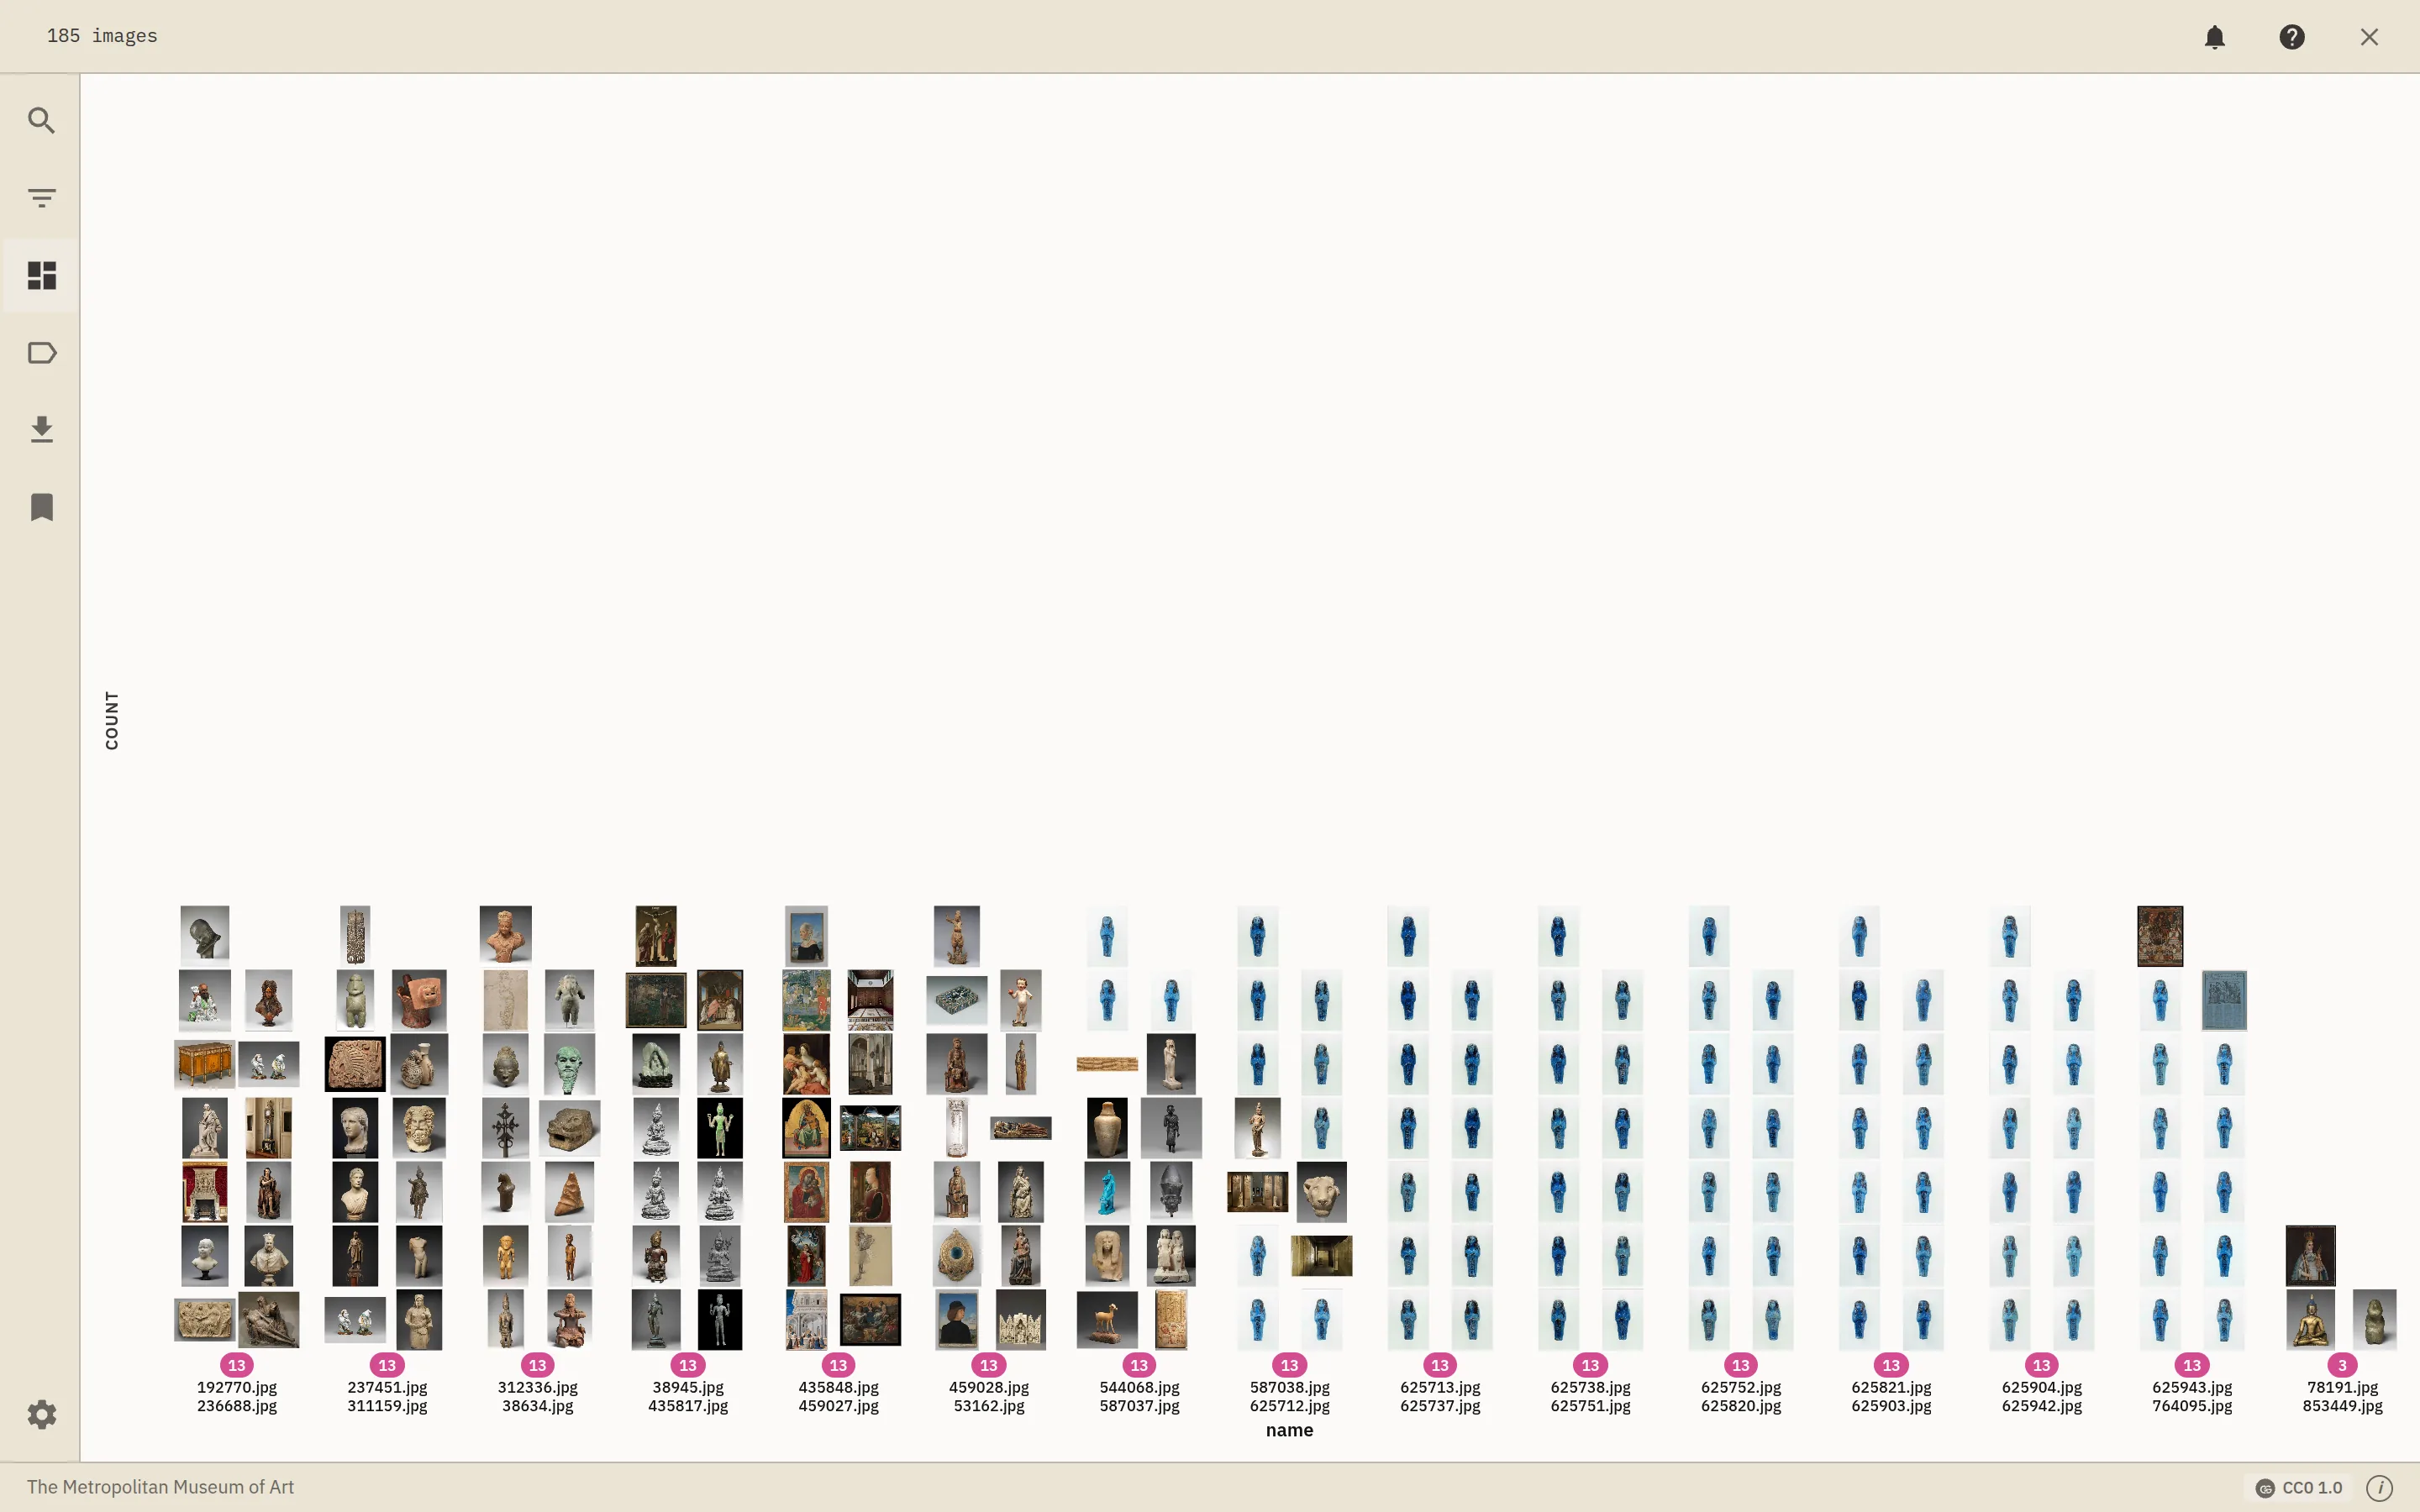
Bins images into columns by a chosen field and stacks them by count — a quick distribution / relationship view across a category.
Map
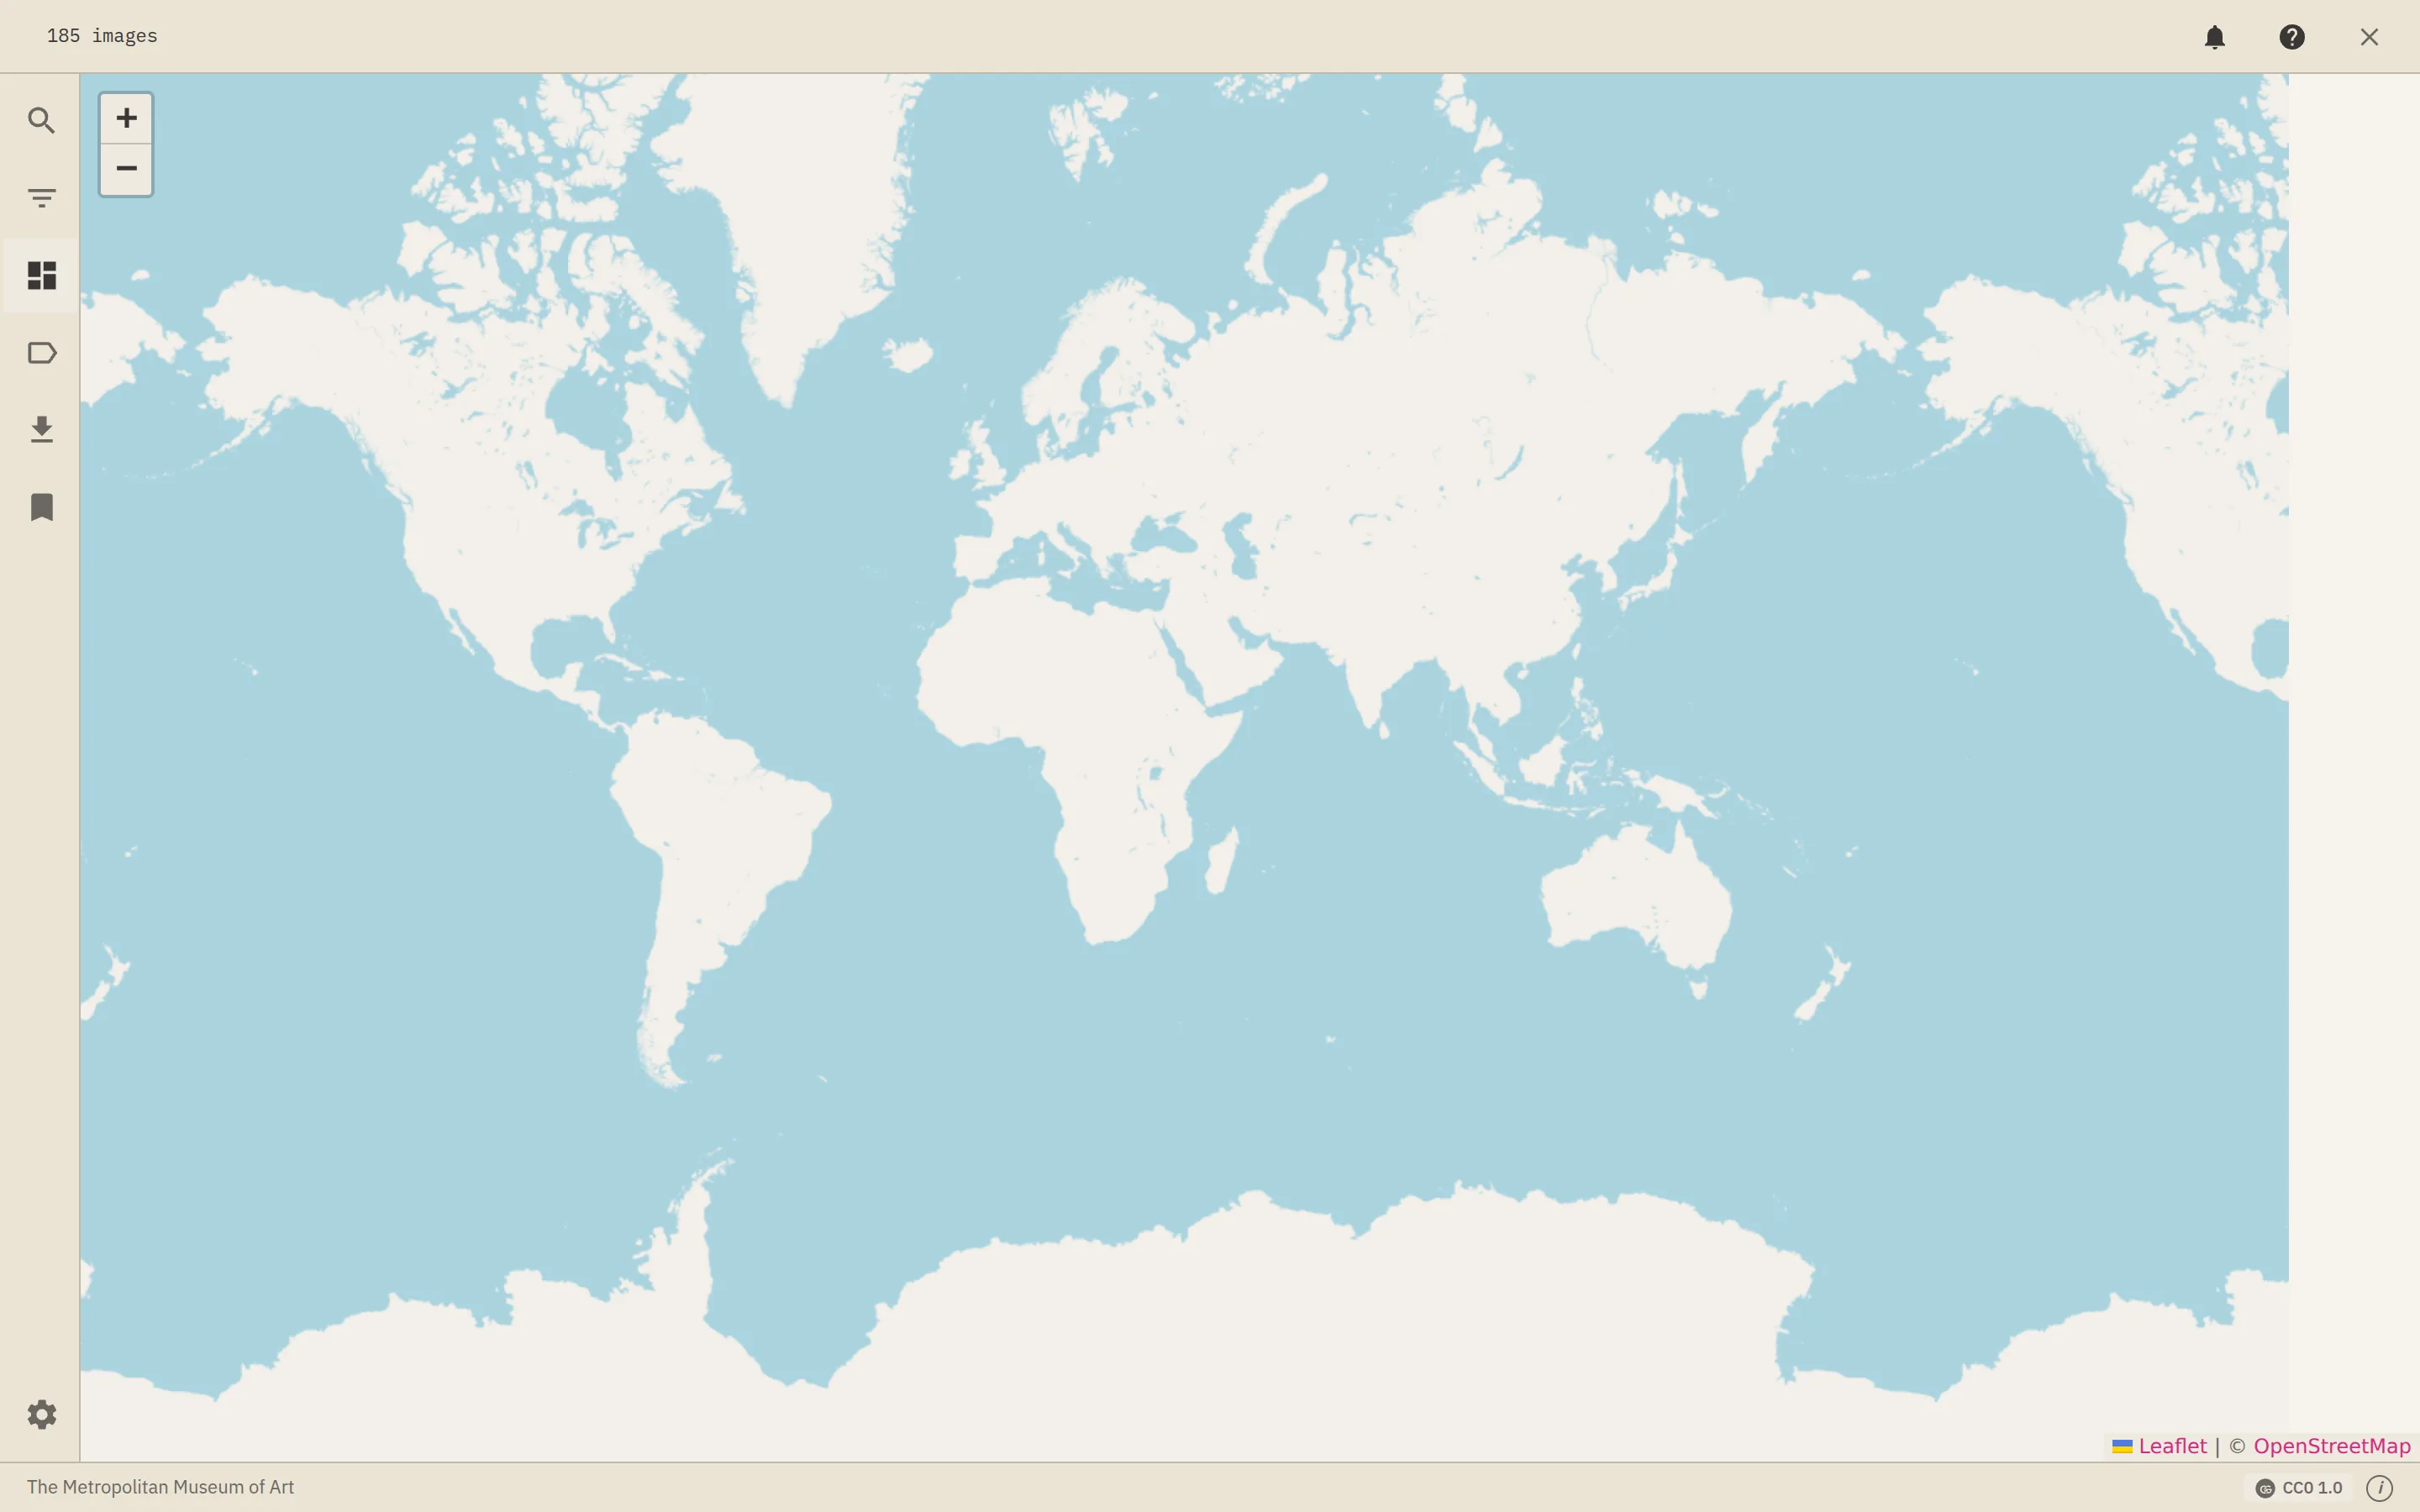
Places images on a world map by latitude/longitude columns. Collections without geo data show the map without points.
Computed columns and outliers
Two collapsible sections at the foot of the Views panel extend what you can sort, colour, and filter by:
- Calculated Columns — derive a new column from a SQL expression over the existing ones (e.g.
width_cm / height_cmfor an aspect ratio). Once added, it behaves like any other column — sort it, colour by it, filter on it. - Outlier Detection — score how unusual each image is and highlight the outliers, useful for spotting mislabelled or anomalous items.
Selecting images
- Click selects a single image (and focuses it).
- Ctrl/Cmd-click adds to the selection; Shift-click extends a range.
- The Selection panel lists what’s selected and offers batch actions; the toolbar badge shows the count.
- Selections feed straight into Export — see below.
The Inspector
Clicking an image opens the Inspector on the right:
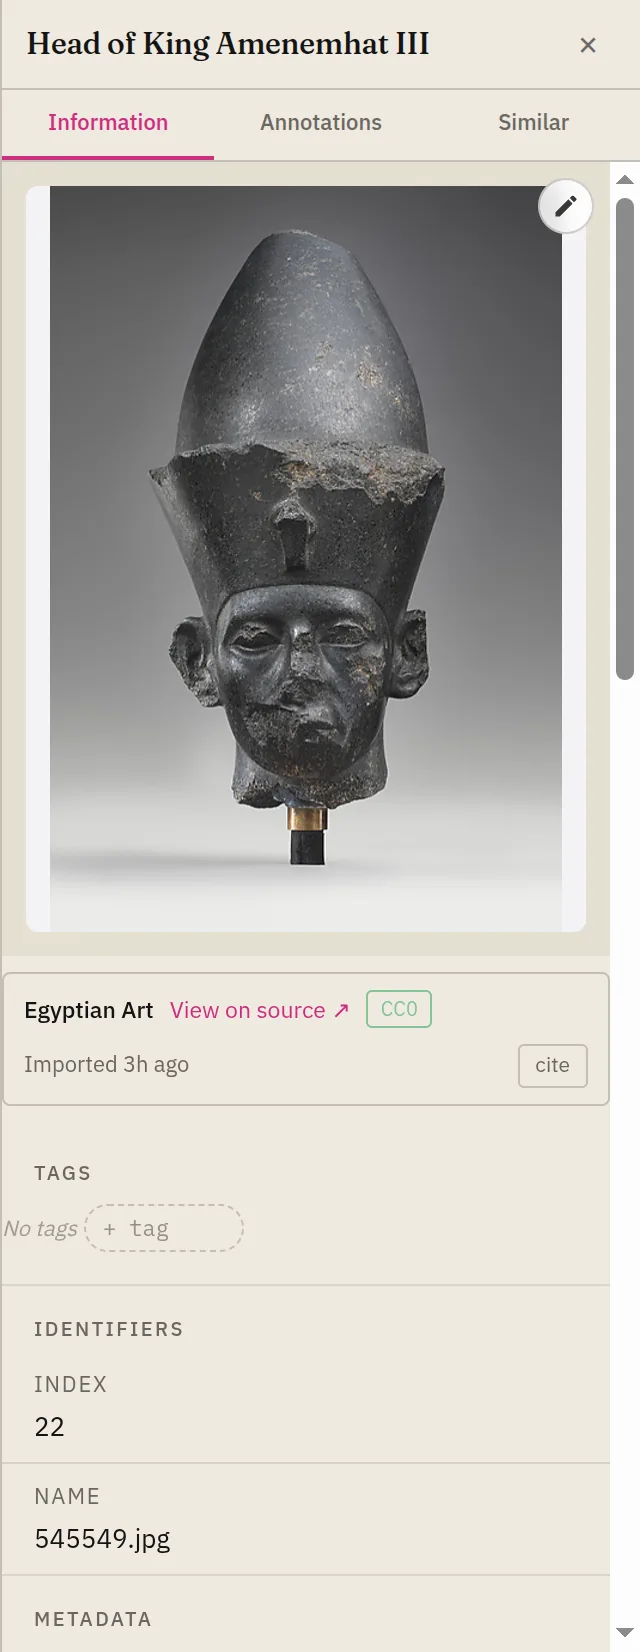
- Information — the image preview, all metadata fields, tags (add/remove), and source attribution / citation.
- Annotations — drawing tools, classes, and image adjustments. See Annotations.
- Similar — visually similar images by CLIP similarity (when the collection has embeddings). See Filtering & search.
Video and PDF. When an item is a video or a multi-page PDF, the preview adapts: videos play with native controls, and PDFs get page navigation so you can flip through pages without leaving the viewer.
Saved views
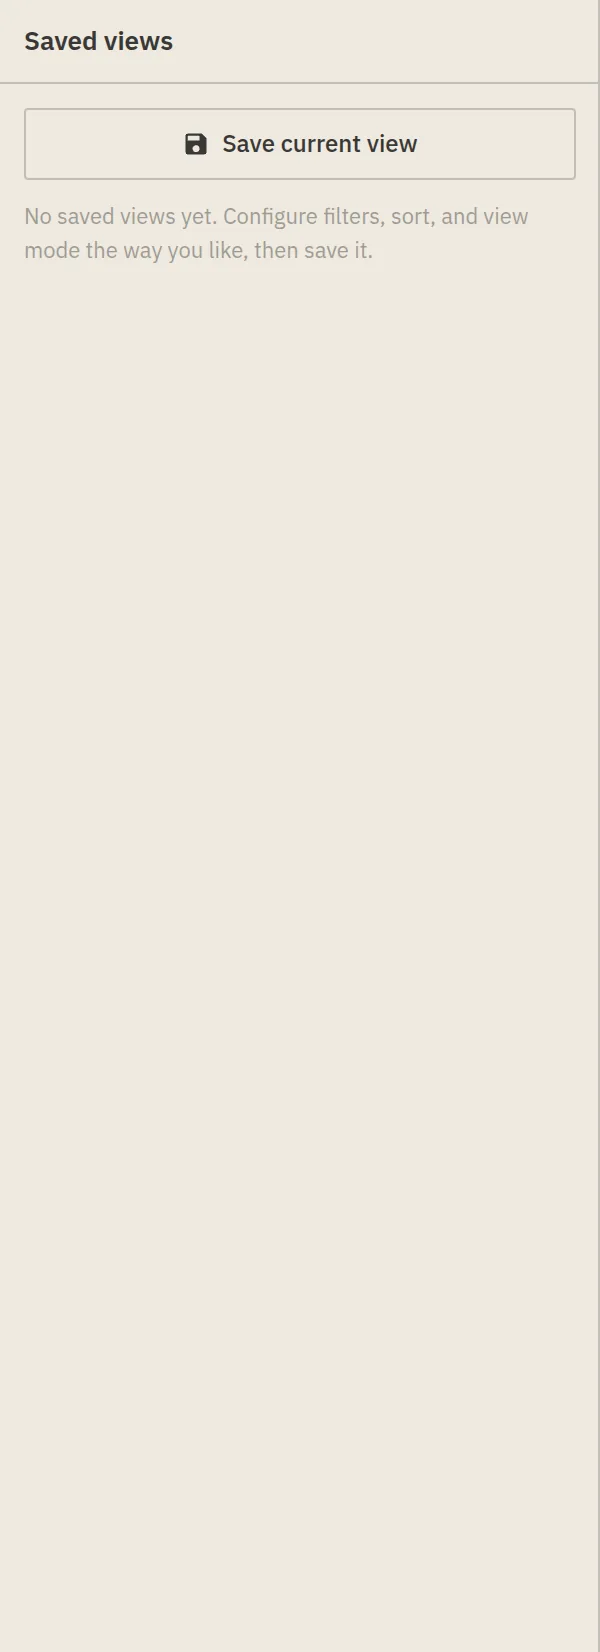
Spent time setting up a view (mode, filters, axes, colour)? The Saved views panel stores it so you — or anyone you share with — can reload that exact state later.
Export
The Export panel turns the whole collection — or just your current selection — into a CSV/JSON, an image ZIP, a PDF, or W3C annotations. See Exporting for the full rundown.
Keyboard shortcuts
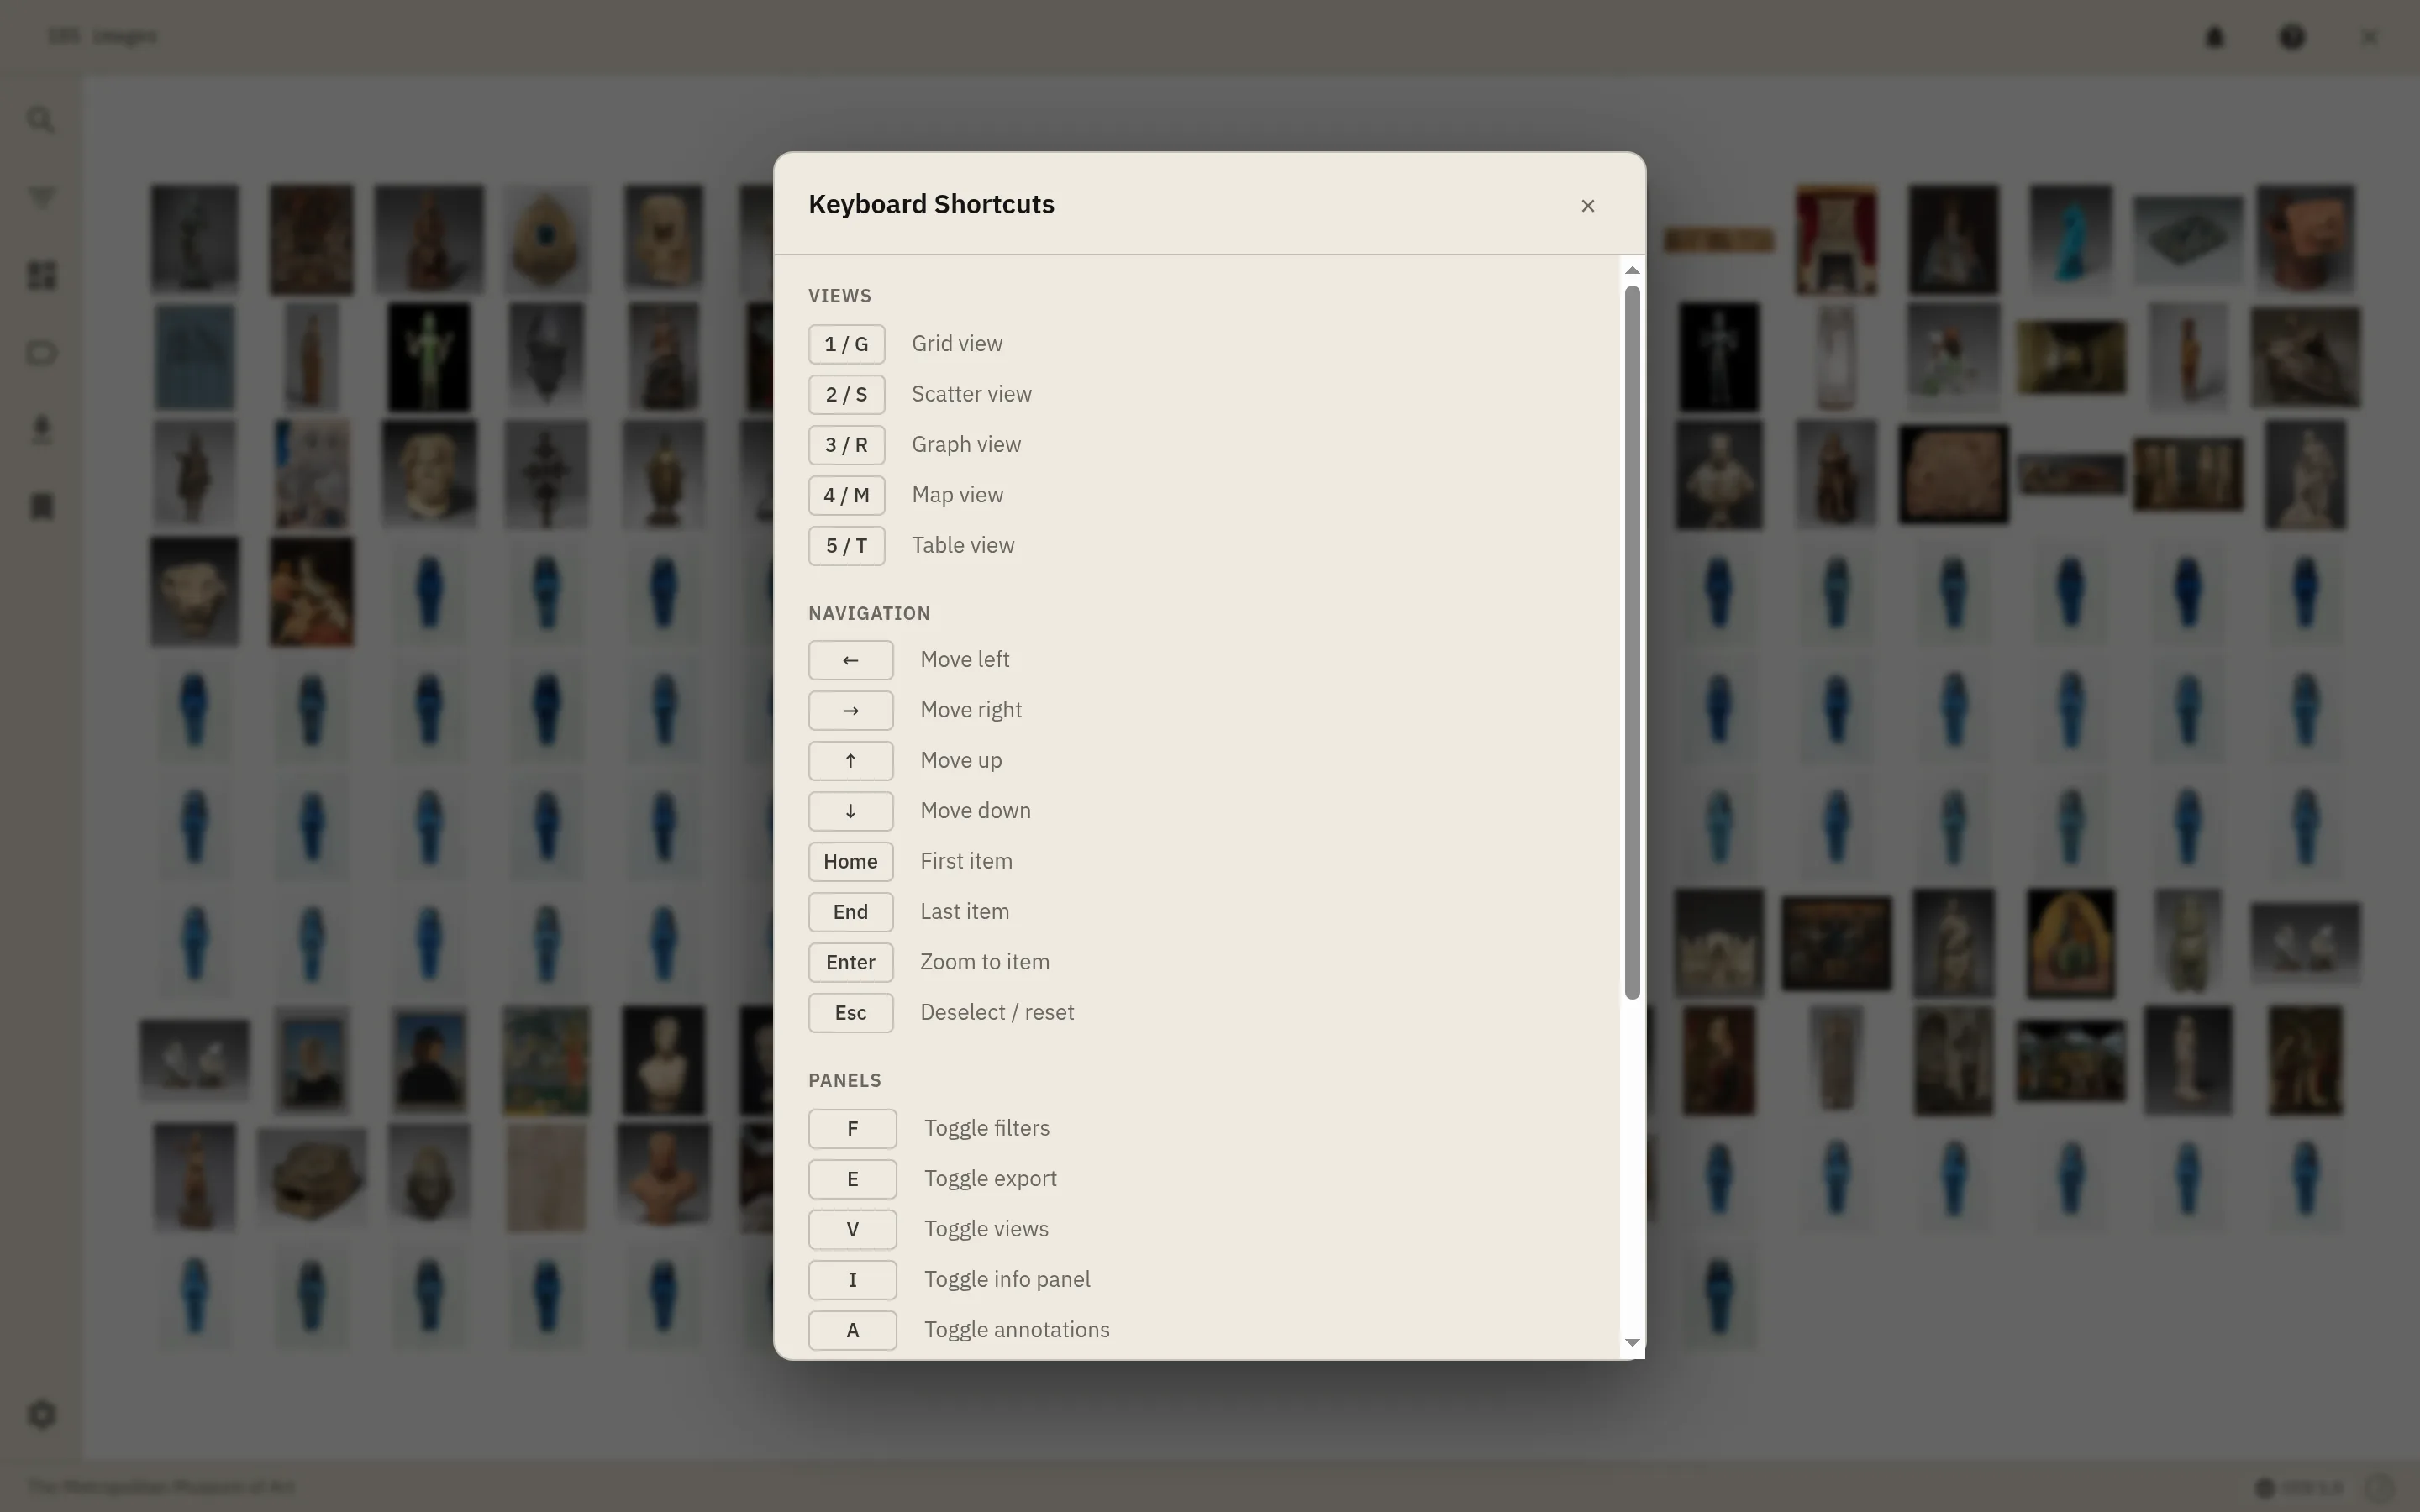
The viewer is keyboard-driven. Press ? at any time for the full overlay; the essentials:
| Keys | Action |
|---|---|
1–5 / G T S R M | Switch view (Grid / Table / Scatter / gRaph / Map) |
← ↑ → ↓, Home, End | Move the focused tile; Enter zooms in, Esc resets |
F V I A E, Ctrl+B | Open Filters / Views / Info / Annotations / Export / Saved views |
/ or Ctrl+K | Jump to search |
Ctrl+A / Ctrl+Shift+A | Select all / deselect all |
? | Show this shortcuts overlay |
See also
- Narrow down what you see: Filtering & search.
- Mark up images: Annotations.
- Volumetric / medical collections: Radiology / medical.
- Change the images themselves: Data tab.